Tribhovandas Bhimji Zaveri: FY26 Earnings Double, But The Bill Comes Due
General information and entertainment, not investment advice. The author is not a SEBI-registered adviser or research analyst. No recommendation, no promised returns. Markets carry risk including loss of capital. Figures may not be current. Consult a registered adviser before acting.
TBZ reported net profit of ₹202.31 Cr for FY26—a 195% jump from ₹68.39 Cr in FY25.
Revenue hit ₹3,202.95 Cr, up 22.2% YoY. The market values the company at ₹1,115 Cr. (Prices referenced are not live; this uses the closing price of ₹167.16 as of June 5, 2026.)
Here’s the tension: profitability surged while borrowings climbed to ₹886 Cr—a debt-to-equity ratio of 1.06. A 160-year-old family jeweller earning outsized returns, but also carrying debt that grows faster than reserves. The working capital monster—₹1,773 Cr stuck in inventory—still hunts for a solution.
Does the margin gain stick, or does the next gold rush leave TBZ overstretched?
2. Introduction
Tribhovandas Bhimji Zaveri, incorporated in 2007, is the publicly listed arm of a 160-year-old family jewellery business. The 5th generation runs it. The company operates 37 stores across 28 cities in 13 states, with a retail footprint of 1 lakh+ sq. ft.
FY26 was unusual: gold prices spiked hard, volumes softened, but margins exploded. The investor presentation flags a “buoyant gold price” that hit volumetric demand but powered operating leverage.
The company’s income statement tells two stories at once.
First, the good: EBITDA margin jumped 446 basis points to 11.18% in FY26, while the company pressed gross margins from 13.66% to 17.47%—a 381 bps surge fuelled by execution and realization gains on unhedged inventory. PAT margin climbed 350 bps to 6.26%.
Second, the strain: borrowings rose 11.9% to ₹886 Cr. Inventory days held flat-ish at 249 days (FY25: 241). The working capital cycle—driven by 31% of inventory as diamonds—remains sticky.
The company sold 3.4 lakh walk-ins in FY26, of which 40% were new and 48% active customers.
3. Business Model: WTF Do They Even Do?
TBZ sells handcrafted gold, diamond, and platinum jewellery through a network of owned and franchised stores. The product menu spans occasion wear (65% of sales), daily wear, and a new range called Dohra—a detachable jewellery system.
Gold manufacturing is outsourced to a network of 150+ regional vendors, each with 100+ kg annual capacity. These relationships are generational; the company leans on them for handmade regional designs and cost control.
Diamond manufacturing runs in-house at a facility in Kandivali, Mumbai. The in-house capability delivers exclusive designs and margin benefits—the presentation flags “lower costs, higher margins.” Diamonds account for ~30% of sales, a strategic bet that lifts the company above commodity-driven pure-gold retailers. The inventory mix (31% diamonds, 69% gold-equivalent) explains why inventory turns slowly: diamonds are slow-moving by nature.
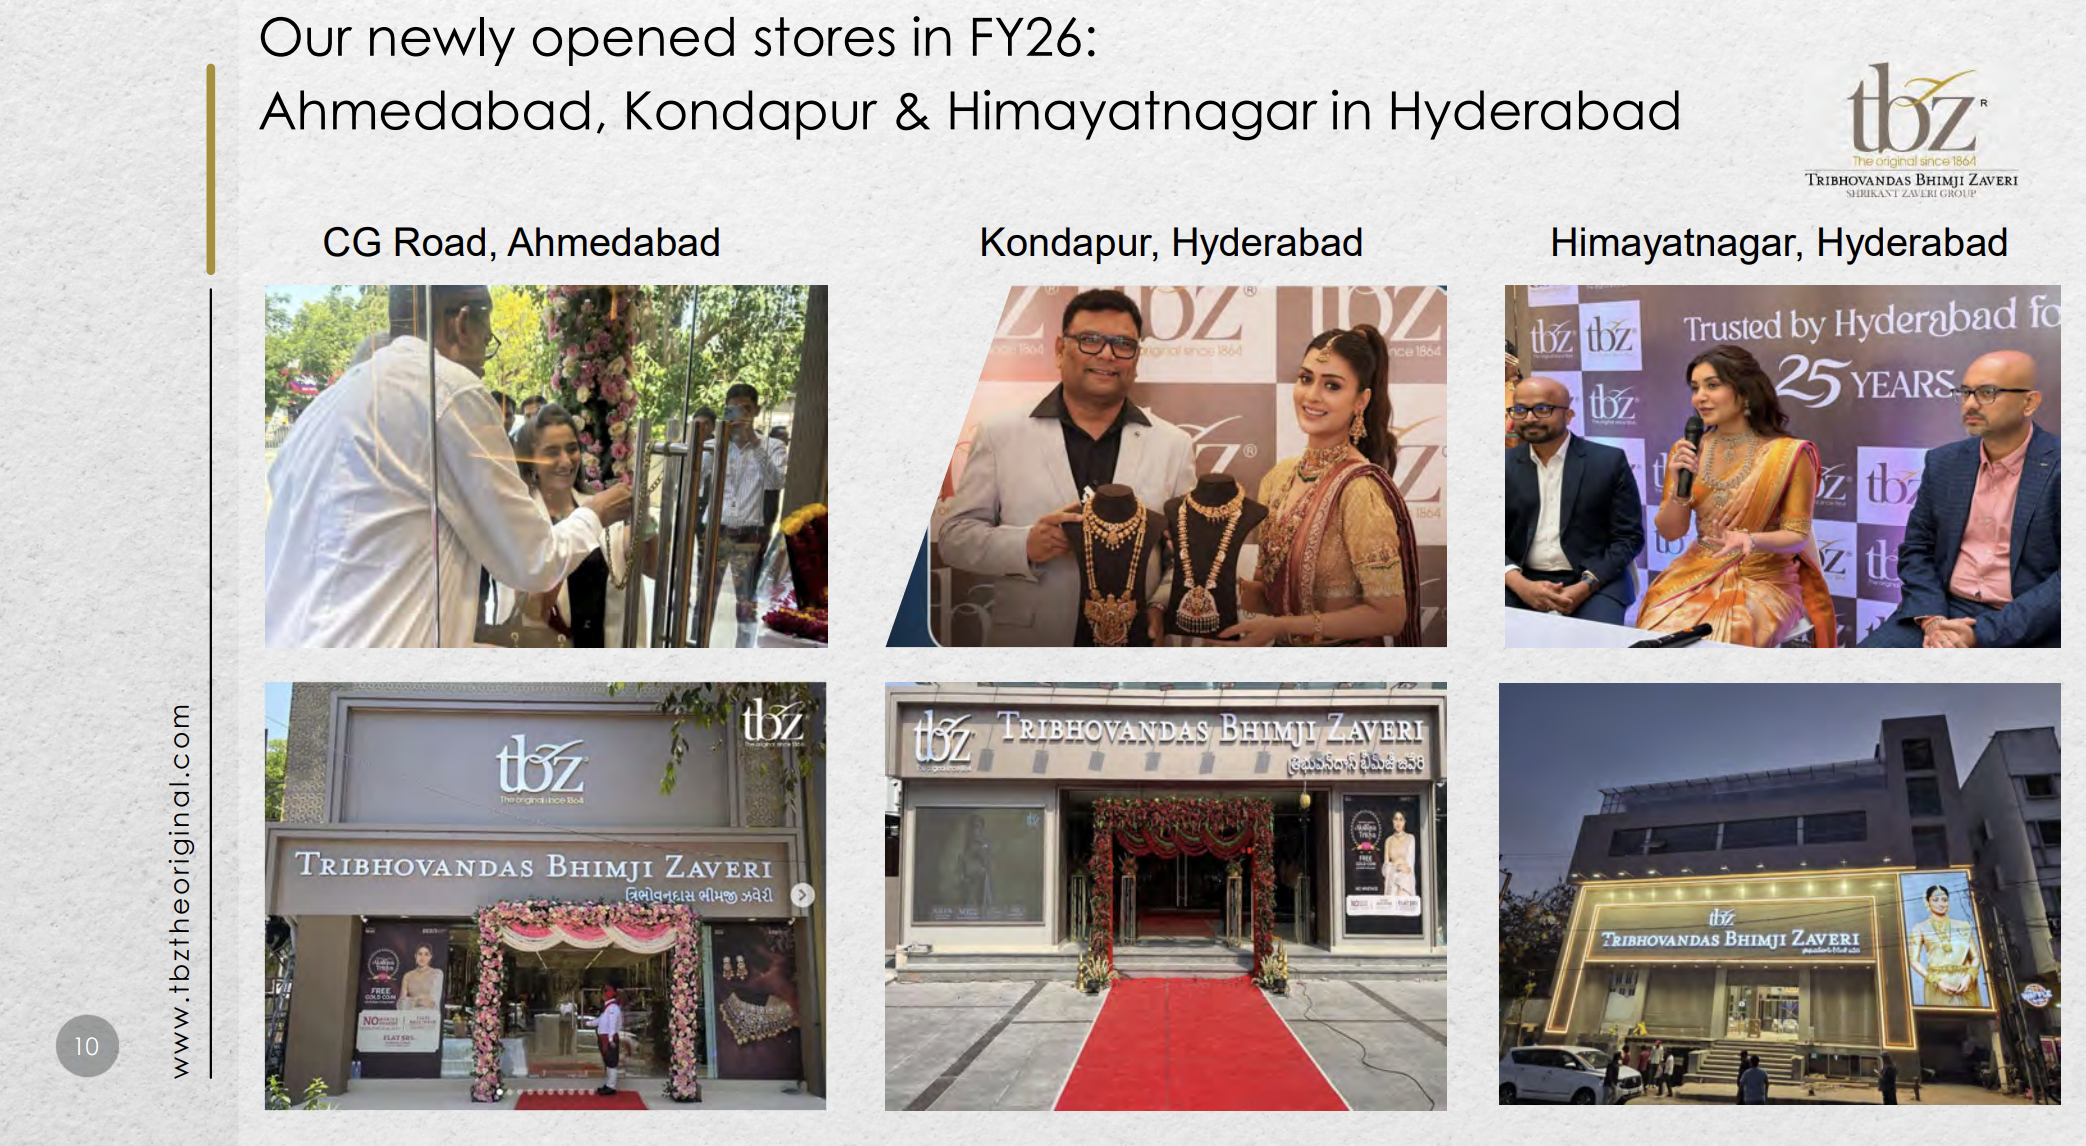
Revenue mix: Maharashtra and Gujarat contribute 50% of sales combined. The company is spreading west (Ahmedabad, Hyderabad, Rajkot, Vadodara, Surat) and east (Kolkata, Lucknow, Patna, Jamshedpur, Kochi). Three stores opened in FY26 (Ahmedabad CG Road, Hyderabad Kondapur, Hyderabad Himayatnagar).
Gold sourcing: The company uses a “gold metal loan” structure with banks. TBZ takes 10 kg of gold on 180-day lease at a rate lower than working capital borrowing. Repayment is daily, pegged to sales. The bank guarantee is 110% of the leased gold. This is tax-efficient for the company—no commodity risk, no mark-to-market loss if gold falls. But if gold spikes (as in FY26), the bank guarantee tops up, and borrowing pressure mounts. This model works until it doesn’t.
The brand message: “The Original since 1864,” family trust, in-house diamond capability, 160-year pedigree. The ad campaigns in FY26 included “A Little More of Everything” (Jan), “Just Hers” (Feb–Mar), and region-specific festive plays.
4. Financials Overview
Figures are consolidated, in ₹ crore.
Metric
FY26
FY25
YoY %
Revenue
3,202.95
2,620.49
22.2%
EBITDA
358.2
176.1
103.4%
PAT
202.31
68.39
195%
EPS (Annualised)
30.33
10.25
195%
Q4 FY26 delivered ₹829.69 Cr in revenue (56.7% YoY growth) and ₹67.64 Cr net profit (612.75% QoQ jump from Q3’s ₹11 Cr). The operating profit margin (OPM) hit 11.27% in FY26, vs. 6.32% in FY25—a 395 bps lift.
The investor presentation attributes the margin explosion to three drivers: (1) better realisation trends and operational efficiencies; (2) unhedged gold inventory gains as prices rose; (3) operating leverage from 22% revenue growth on a 5% cost-of-sales growth.
From the May 2026 concall: Management indicated that the 195% profit growth is “materially enhanced bottom-line performance despite higher finance and depreciation costs.” This is honest. The company added 3 stores, marketing spend rose, and finance costs climbed because borrowings rose. Yet profit still tripled.
The punchline: TBZ printed 195% earnings growth in a year when gold prices (not volume) did the heavy lifting. The margin gain is real, but gated by the company’s ability to keep inventory velocity steady. If inventory turnover slips, margin collapses.
5. Valuation Discussion: Fair Value Range (Educational Only)
What follows is a walkthrough of how three valuation methods work, using this company’s numbers as the example — not a target, not a forecast, not advice.
Method 1 (Reported P/E): Annualised reported EPS is ₹30.33 (full FY26 net profit ÷ 6.67 Cr shares). The market paid 5.51x at ₹167.16. Peer multiples for organised jewellers range from 12–73x across Titan, Kalyan, Thangamayil, and PC Jeweller. TBZ sits at the low end of the band. Method 1’s arithmetic outputs a range of ₹180–222 if the company were valued at the peer median (16.89x) against the current ₹167 price.
Method 2 (EV/EBITDA): FY26 EBITDA stands at ₹358.2 Cr. Net debt is borrowings (₹886.22 Cr) minus cash (₹101.83 Cr) = ₹784.39 Cr. Enterprise value at the current market cap of ₹1,115 Cr is roughly ₹1,900 Cr (market cap + net debt). EV/EBITDA is 5.3x. Peer EV/EBITDA multiples range from 5–47x. At the peer median of 20–24x, the arithmetic produces ₹1,900–2,150 Cr in EV, or ₹785–1,035 in implied equity value.
Method 3 (Simplified DCF, 5-year horizon): Assume 15% revenue CAGR (below historical 22%), 9% PAT margin (below FY26’s 6.26% but above FY25’s 2.76%), a 10% terminal growth rate, and 12% discount rate. The terminal value (Year 5 cash flow × perpetuity factor) dominates the output. A ₹400+ Cr unlevered FCF in Year 5, discounted at 12%, suggests fair value in the ₹800–1,100 Cr range, or ₹120–165 per share. This assumes execution sticks; margin compression of 100–200 bps would collapse the number to ₹90–110.
These figures show how the methods work and are not a valuation, a target, or advice.
6. What’s Cooking
New Store Footprint: Three stores opened in FY26—Ahmedabad CG Road (flagship), Hyderabad Kondapur, Hyderabad Himayatnagar (Jan 2026). The company now runs 37 stores (33 large format >2,000 sq. ft., 4 small format). The investor presentation signals