Tractors India(TIL) Ltd FY26: The Turnaround Nobody Saw Coming (Yet)
General information and entertainment, not investment advice. The author is not a SEBI-registered adviser or research analyst. No recommendation, no promised returns. Markets carry risk including loss of capital. Figures may not be current. Consult a registered adviser before acting.
1 — At a Glance
A company that lost ₹31 Cr in FY26 is now worth ₹1,475 Cr at the stock market’s prices. That gap—the space between what the balance sheet shows and what the market pays—is the whole story.
New management took over in January 2024 with ₹120 Cr in hand. They’ve raised another ₹60 Cr via warrants and ₹200 Cr via rights. The order book swelled to ₹274 Cr by May 2026, roughly matching annual sales.
Margins are coming back. Q4 FY26 saw operating profit of ₹9.89 Cr on ₹108.84 Cr in sales. The same quarter in FY25 showed ₹-28.18 Cr operating profit. Factories are stirring after years in storage mode.
Does this fix the capital destruction, or does it just delay the conversation? That’s the question the market is pricing.
2 — Introduction
TIL was a crane manufacturer in the 1960s. For fifty years it was a respectable business in material handling. Then came the supply chain collapse and liquidity death spiral of 2020–22. Revenue fell from ₹377 Cr in FY20 to ₹43.83 Cr in FY23.
The old promoters ran out of runway. In January 2024, Sunil Kumar Chaturvedi of the Gainwell Group—a Caterpillar dealer with deep engineering roots—acquired 71% of the company for ₹120 Cr. At the time, TIL’s net worth was negative. Gainwell had money, intent, and an ecosystem.
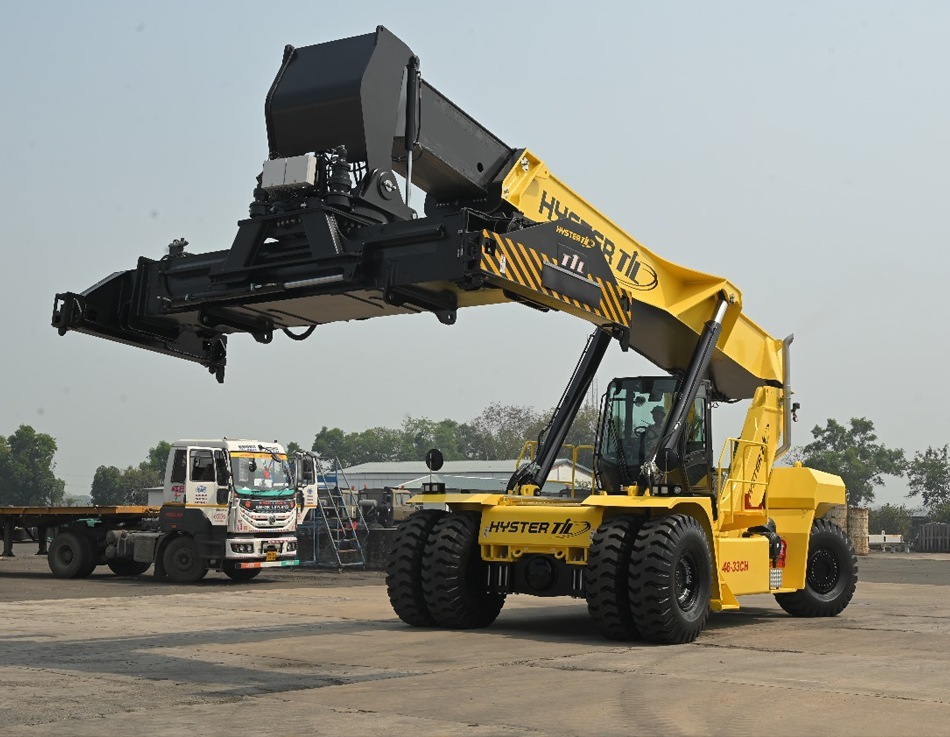
FY26 saw the company recover to ₹323.25 Cr in sales, add ₹274 Cr to the order book (especially from defence and ports), and restart dormant partnerships with Grove, Manitowoc, and Hyster. A Snorkel partnership entered in August 2024 carries ₹200 Cr revenue potential by FY28.
The balance sheet is still a mess. But momentum is readable.
3 — Business Model: WTF Do They Even Do?
TIL manufactures fifty different models of equipment: mobile cranes (10–150 ton capacity), reach stackers, forklift trucks, container handlers, hot-mix asphalt plants, and road construction gear. It also resells under partnership agreements.
Revenue mix in FY26: 79% manufactured goods, 21% traded goods and services (numbers sourced from interim filings; structure matches prior-year ratios).
Geography is locked: 99% India, 1% overseas. That’s a strategic choice. Customers are defence (DRDO, Army), PSUs (Coal India, NTPC, DP World, Adani), and large construction groups. The network spans five regional offices.
This is a cyclical business hiding inside an order-driven business. A ₹50 Cr order for twenty reach stackers looks like a revenue surge but is really four quarters of delivery plus margin risk on input costs. Government contracts move slowly but rarely disappear. Private construction cycles and mining booms set the floor.
4 — Financials Overview
Figures are consolidated, in ₹ crore.
Metric
FY26
FY25
YoY Change
Revenue
323.25
315.28
+2.5%
EBITDA
53.61
41.79
+28.2%
PAT
-30.77
2.86
-1176%
EPS (annualised)
-3.73
0.43
—
What happened: Sales ticked up 2.5%. EBITDA rose 28%, meaning the business is fixing its operating margins even as total profit fell off a cliff.
The cliff came from two sources: (1) FY25 included ₹168.59 Cr net profit in Q4 alone, a one-time gain on old liabilities written back. (2) FY26 absorbed ₹84 Cr in old tax demands (West Bengal VAT and entry tax disputes settled under a state amnesty scheme in March 2026) plus the cost of new hires—supply chain heads, production heads—whose productivity hasn’t yet shown.
Interest expense was ₹46.26 Cr, up from ₹30.21 Cr, because the company has borrowed to fund working capital and acquisition of Tulip Compression (₹119 Cr paid in May 2026 for 60% of a CNG/LNG/hydrogen equipment maker). Depreciation was ₹7.35 Cr.
The cash flow: operating activities burned ₹88.44 Cr (mostly working capital build on the rising order book). Investing burned another ₹17.47 Cr. Financing injected ₹110.02 Cr (equity and debt raises). Net result: +₹4.11 Cr cash in the bank.
5 — Market Expectations & Historical Multiples
This section describes how the market is currently pricing the company and how that compares with its own history and peer group. It is descriptive, not predictive.
Metric
Current
Historical Average (5Y)
Peer Median
P/E
NA
69.6x
29.7x
EV/EBITDA
34.3x
—
22.1x
P/B
13.3x
—
4.9x
ROE
-26.2%
—
11.1%
ROCE
2.6%
—
14.4%
The market does not assign an earnings multiple to a loss-making stock. EV/EBITDA sits at 34.3x—roughly 55% above the peer median of 22.1x—which means the market is pricing in either margin recovery (to reduce denominator) or revenue growth (to support the numerator). The price-to-book of 13.3x is nearly three times the peer median of 4.9x, despite negative ROE and ROCE sitting 560 basis points below the peer set.
What is the market pricing in? A belief that the order book executes at the margins management is now seeing (9-12% operating margins in recent quarters), that Tulip Compression adds 100+ Cr in revenue, that defence orders accelerate, and that the capital cycle doesn’t reverse. The company’s working capital cycle is still elongated—239 debtor days, suggesting government contracts and slow payment terms—but has improved from 325+ days in FY24.
6 — What’s Cooking
Defence and PSU Orders (₹200+ Cr pending): The order book split is roughly 70% defence/PSU, 30% private. Defence equipment is long-cycle and low-margin, but stable. Orders include specialized lifting equipment for Indian Armed Forces (40 units already supplied; more pending).
Tulip Compression Acquisition (₹119 Cr, 60%): Completed May 2026. TCPL manufactures CNG, LNG, and hydrogen storage equipment. No financials are in the public record