Search for Stocks /

Swan Defence FY26: ₹282 Crore Revenue, ₹226 Crore Loss, and a Ship Repair Restart

Spotted a factual error — a wrong number, date, or fact? Tell us and we will check the source.

General information and entertainment, not investment advice. The author is not a SEBI-registered adviser or research analyst. No recommendation, no promised returns. Markets carry risk including loss of capital. Figures may not be current. Consult a registered adviser before acting.


1 — At a Glance

A shipbuilder that arrived from bankruptcy in January 2024 just posted its full-year results.

Revenue for FY26 hit ₹282 crore—a leap from ₹7 crore the prior year, but a fraction of what the 662-metre dry dock and 164,000-MT fabrication facility should be running at capacity.

The year’s net loss: ₹226 crore. Quarterly sales in the last quarter alone were ₹236 crore, a clue that most of the year was silent; the company only ramped late in Q4 after a ship-repair order arrived in August 2024.

Borrowings have compressed from ₹2,505 crore (FY25) to ₹2,788 crore (FY26)—wait, that’s up ₹283 crore. The balance sheet has swung from reserves of ₹243 crore to ₹17 crore.

A fresh order: four ammonia dual-fuel bulk carriers at 92,500 DWT each. First delivery October 2029.

The tension: vast infrastructure meets near-zero utilisation. Order book sitting at ~$500 million (reported) — roughly one year of capacity at full tilt.


2 — Introduction

Swan Defence and Heavy Industries landed in its current hands in January 2024, emerging from Corporate Insolvency Resolution that began in 2020. The predecessor, Reliance Naval & Engineering, buckled under ADAG’s group crises and lender action.

Swan Corp (the parent, itself part of a broader industrial conglomerate with textile, real estate, oil & gas, and tech arms) acquired the shipyard as a going concern. The company took operational possession in January 2024 and commenced ship repair in August 2024 with the Indian Coast Guard as the first customer.

Major events this fiscal: possession stabilisation, repair restart, an ammonia carrier order, a ₹4,000-crore fundraise approval, and a CFO transition.

The market has noticed. Stock price year-on-year: up roughly 1,056% (per data), though that metric is loose on a turnaround asset with heavy equity dilution already baked in.


3 — Business Model: WTF Do They Even Do?

Swan Defence operates three concurrent lanes: commercial shipbuilding, defence/naval shipbuilding, and ship repair + heavy engineering fabrication.

Commercial Shipbuilding: Panamax bulk carriers, offshore support vessels, deck cargo barges, jack-up units. The newly won order—four ammonia dual-fuel carriers—lands here. These are high-tonnage, complex builds with multi-year cycles.

Defence & Naval: Teaming agreements with Mazagon Dock and Garden Reach Shipbuilders for Landing Platform Docks and other warship sections. The company frames itself as a subcontractor/partner yard, not the lead builder. This hedges risk but caps upside.

Ship Repair + Fabrication: The offshore yard (750m × 265m) and fabrication facility (340 acres in an SEZ, including India’s largest pipe shop making 1,000 spools daily) service oil & gas, offshore wind, and government contracts. Ship repair kicked off in Aug 2024. Two repair slots already lined up.

The model’s tension: A £35-billion-plus global shipbuilding market where Swan has ~0.1% share. The company has the hard assets (dry dock, presses, blast cells, crane capacity) but minimal order backlog relative to capacity. Success means filling that gap over 3–5 years. Failure means carrying massive fixed costs on thin utilisation—which is, factually, where it sits now.


4 — Financials Overview

Figures are consolidated, in ₹ crore.

Yearly Results (FY Ending March 31)

MetricFY24FY25FY26YoY Change
Revenue7282+3,914%
EBITDA-108-310(wider loss)
PAT-121-181-226wider loss
EPS (₹)-22.89-34.36-42.89worse

Quarterly Trend (Q4 FY26 standout)

MetricQ3 FY26 (Oct-Dec ’24)Q4 FY26 (Jan-Mar ’25)
Revenue5.87236.28
Operating Loss-20.04-250.40
Net Loss-33.11-142.22

Q4 revenue spiked 40x quarter-on-quarter. Operating loss widened in absolute terms, because the ₹236 crore in Q4 sales carried manufacturing expenses (₹487 crore in the quarter) and interest burden. The company is still pre-profit, burning cash on overhead while ramp-up orders mature.

Management Concall Signals (from announcement digest, 27 May 2026):

  • FY26 revenue hit ₹440 crore, PAT ₹34.5 crore. (These figures exceed the consolidated audited result above—likely including adjustments, one-time gains, or subsidiary consolidation changes; trust the audited consolidated P&L linked to Excel as the standard.)
  • Order book valued at ~$500 million.
  • Board approved a ₹4,000-crore fundraise via QIP, preferential issue, or debt.
  • CFO transition effective 27–28 May 2026.

The discrepancy between announced (₹440 crore revenue, ₹34.5 crore PAT) and audited consolidated (₹282 crore revenue, -₹226 crore PAT) warrants a re-read of the full results document and investor concall transcript—they may be pro-forma, standalone, adjusted, or segment-specific. For now, the audited consolidated figures are the safe anchor.


5 — Valuation Discussion: Fair Value Range (Educational Only)

What follows is a walkthrough of how three valuation methods work, using this company’s numbers as the example — not a target, not a forecast, not advice.

Method 1 (P/E Multiple): Annualised FY26 EPS is -₹42.89. A company with negative earnings has no meaningful P/E. The market price of ₹1,971.60 (as of 5 June 2026) on net losses produces a negative earnings yield. This method does not yield a range here; it highlights that P/E-based valuation is inoperative until profitability returns.

Method 2 (EV/EBITDA): Enterprise Value = Market Cap + Net Debt. Market cap ≈ ₹10,387 crore. Net Debt = Borrowings (₹2,788 cr) − Cash (₹289 cr) = ₹2,499 crore. EV ≈ ₹12,886 crore. EBITDA FY26 = -₹310 crore. EV/EBITDA is negative and meaningless. The company does not generate positive EBITDA; losses deepen when adding back depreciation and interest.

Method 3 (Simplified DCF — Asset Basis): The shipyard’s tangible value sits in fixed assets (₹1,187 crore net block), CWIP (₹166 crore invested in capacity upgrades), and inventory (₹952 crore work-in-progress on ship orders). Total net asset position: Equity (₹53 crore share capital + ₹17 crore reserves = ₹70 crore) versus Liabilities (₹3,167 crore). The balance sheet shows negative net worth of ≈ -₹3,097 crore if you subtract liabilities from total assets. A liquidation or distressed scenario would invoke the dry dock’s scrap and resale value (~₹1,500–2,000 crore, if the market found a buyer), less debt claims.

No method produces a bullish “fair value” band. The company is unprofitable, burning equity, and dependent on order intake and execution to climb out.

These figures show how the methods work and are not a valuation, a target, or advice.


6 — What’s Cooking

Ship Repair Start (August 2024): Indian Coast Guard became the first customer. Two additional vessels docked in Nov 2024. This diversifies away from the multi-year build cycle and locks in recurring shorter-term revenue. The repair yard is ONGC-approved for offshore work. Margin profile on repairs is typically healthier than on new builds.

Four Ammonia Dual-Fuel Carriers (April 2026): Category 4 order for four vessels at 92,500 DWT each. The “ammonia dual-fuel” spec signals the buyer is hedging future fuel regulation; ammonia is a zero-carbon fuel candidate gaining traction in decarbonisation. First delivery expected October 2029. Build cycle is ~3–4 years. This is a high-tonnage, complex build—margins depend on cost discipline.
₹4,000 Crore Fundraise (27 May 2026): Board approved a capital infusion. Mode TBD: QIP (Qualified Institutional Placement), preferential issue to promoters, or debt. The company needs ₹2,500–4,000 crore to fund capacity expansion (second dry dock, goliath crane upgrades, CWIP completion) and burn cover during the ramp-up phase. Equity dilution is a given.

Triumph Offshore Amalgamation (May 2026): Shareholders approved an amalgamation scheme with Triumph Offshore Private Limited on 25 May 2026. NCLT order followed. This is a related-party consolidation within the Swan Corp group—likely a back-office tidy-up or asset pooling. Impact on standalone Swan Defence P&L TBD.

CFO Transition (27 May 2026): The Chief Financial Officer resigned effective 27–28 May 2026. A replacement appointment was announced in parallel. This signals routine succession, not distress, but governance notes on timing and interim coverage are sparse.

Promoter Share Disposition (March 2026): Hazel Infra (the holding company, 89.9% stake) received pre-clearance to dispose of up to 2.6 million shares. This marks a 5% reduction in promoter ownership since Dec 2024 (94.91% to 89.90%). The sale is likely a partial unlock / liquidity event, not an abandonment.


7 — Balance Sheet

ItemFY24FY25FY26Change FY25 → FY26
Total Assets2,7432,8923,167+275
Net Block (Fixed Assets)1,1681,1801,187+7
CWIP (Capital Work-in-Progress)43155166+11
Inventory1,4051,401952-449
Cash & Bank1929289+260
Total Equity47529670-226
Borrowings2,2192,5052,788+283
Other Liabilities4891310+219
Total Liabilities2,2682,5963,097+501

The Shape: Assets grew ₹275 crore (mostly cash inflow and inventory shrink). Equity collapsed ₹226 crore—the FY26 net loss. Borrowings rose ₹283 crore, meaning debt burden increased as the loss mounted. The company is financing operations with borrowings, not retained earnings.

Cash jumped ₹260 crore, a relief. This suggests either a debt drawdown, working capital inflow from the late Q4 revenue spike, or an interim advance from the parent. Inventory fell ₹449 crore—likely because Q4 builds shipped, reducing work-in-progress stock.

Three Observations:

First, the equity cushion is razor-thin: ₹70 crore in a ₹3,167-crore liability base. Debt-to-Equity ratio is 39.8x. One more year of ₹200+ crore losses and equity turns negative (technical insolvency, though operationally the company may keep trading).

Second, CWIP of ₹166 crore is a bet on capacity expansion (second dry dock, crane, facility upgrades). This is future capacity that won’t generate revenue until completion. If order intake stalls, CWIP becomes a sunk cost trap.

Third, the ₹289-crore cash pile is recent and fragile—a single large shipyard outage, order cancellation, or working-capital surge could evaporate it.

Net Cash Position: Cash (₹289 cr) − Borrowings (₹2,788 cr) = Net Debt of ₹2,499 crore. The company is not debt-free and never was.


8 — Cash Flow: Sab Number Game Hai

YearOperatingInvestingFinancingNet CF
FY24-70-1191+10
FY25-96-162268+10
FY26182-440413+155

FY26 showed a rare operating cash inflow of ₹182 crore—a swing from -₹96 crore the year prior. This is the Q4 revenue spike at work. Orders received in late Q4 brought advances and receivables that converted to cash, masking the PAT loss below the line.

Investing outflows jumped to -₹440 crore (versus -₹162 crore), driven by the CWIP spend on capacity upgrades and working capital build. This is capex for the future, not an operational burn.

Financing inflows of ₹413 crore cover debt drawdowns and likely a bridge advance from Swan Corp (the parent). The net cash position ticked up ₹155 crore year-over-year.

Wisdom line: Cash flow and profit are cousins, not twins. The company is cash-positive this quarter because order advances are arriving. That doesn’t mean the business is healing—it means the timeline of cash receipts has shifted. Once that queue of orders ships, cash will reverse unless new orders land.


9 — Ratios: Sexy or Stressy?

RatioValueReading
ROE-124%Shareholder capital is being consumed. For every ₹100 of equity, the company lost ₹124 in a single year.
ROCE-7.55%Capital employed (assets + borrowings) is generating negative returns. The machinery is not earning its keep.
PAT Margin-80%Every rupee of revenue costs ₹1.80 to deliver (before interest and tax). The unit economics are inverted.
D/E39.8xDebt is 39.8 times equity. This is extreme leverage in a loss-making company.
Current Ratio4.49Current assets (₹1,306 cr: cash, inventory, receivables) vs current liabilities (₹291 cr) — short-term liquidity is comfortable.

Line-by-line:

ROE at -124% is not a ratio to celebrate—it’s a warning. The shareholder base is being diluted by losses faster than operations can recover.

ROCE at -7.55% says the company’s capital base (its factories, debt-financed assets) is value-destroying, not value-creating. A healthy industrial business targets 12–15%+. Negative ROCE means the market would be better off if the assets were sold and cash returned.

PAT Margin of -80% is the core wound: the business cannot yet cover its cost of delivery. This is a pre-revenue, building-phase profile, not a mature shipyard.

D/E of 39.8x is alarm-level. Equity is a sponge soaking losses. Lenders are senior to equity; equity absorbs the risk first. At this D/E, a covenant breach or debt restructuring is a real edge case if cash generation doesn’t improve by FY27.

Current Ratio of 4.49 is misleading comfort. Inventory of ₹952 crore is illiquid (it’s half-built ships). Cash of ₹289 crore is real, but it’s financing a ₹2,788-crore debt pile. The ratio passes a liquidity test, but solvency (can you pay debt over 3–5 years?) is the real question.


10 — P&L Breakdown: Show Me the Money

YearRevenueEBITDAPATNotes
FY240-29-121Idle post-bankruptcy.
FY257-108-181Possession handover, minimal orders.
FY26282-310-226Late Q4 spike, but cost structure still negative.

EBITDA (Operating Profit + Interest + Depreciation + Amortisation) turned more negative (from -₹108 cr to -₹310 cr) even as revenue leapt ₹275 crore. This seems counterintuitive until you check the expenses:

  • Operating expenses (raw material, power, labour, admin) spiked ₹593 crore in FY26 vs. ₹115 crore in FY25.
  • Interest fell from ₹21 crore to ₹12 crore (debt paydown underway, a good sign).
  • Depreciation stable at ₹63 crore.

The company’s cost base is rigid: fixed overhead (salaries, facility, utilities) doesn’t drop with low utilisation. When the shipyard is 20% full, costs don’t shrink to 20%. They stay north of 80% of capacity. Revenue must climb sharply to leverage those fixed costs. Q4 showed the ramp, but it’s still not enough to cross breakeven in a single quarter.

Trajectory: The business trajectory is pre-inflection. Revenue is climbing exponentially (0 → 7 → 282 crore). Profit is still deeply negative. The inflection point—where revenue growth outruns fixed-cost growth—hasn’t been crossed. If order intake sustains and ship delivery ramps, FY27 and FY28 are the years to watch for EBITDA breakeven.


11 — Peer Comparison

CompanyRevenue (₹ cr)PAT (₹ cr)P/EROCE (%)ROE (%)
Mazagon Dock13,0062,58337.83629.2
Cochin Shipyard5,02271752.81612.5
Swan Defence282-226-7.6-124
Laxmipati Engg727.522.921.834.0
Haryana Shipbuilders3.5115.511.87.5

Peer Positioning:

Mazagon Dock is a heavyweight: ₹13,000 crore in revenue, ₹2,583 crore profit, 36% ROCE. It’s the Indian Navy’s flagship builder. Swan is 45x smaller in revenue and ₹2,800+ crore underwater in profit.

Cochin Shipyard is mid-tier: ₹5,000 crore revenue, profitable. Swan is 18x smaller.

Swan is the smallest listed player. The gap is not a scaling issue—it’s a utilisation issue. Mazagon runs its dry docks hot with Navy contracts. Swan is ramping from near-idle. Over the next 3–5 years, Swan could approach 10–15% of Mazagon’s size if orders stick and execution holds. That would put it at ₹1,500–2,000 crore revenue and breakeven to ₹50–100 crore profit.

The multiple table shows Swan’s absence in P/E (negative earnings), and the wide gap in ROCE (36% vs. -7.6%) and ROE (29% vs. -124%). Peers are money-makers; Swan is a capital sink for now.


12 — Miscellaneous: Shareholding & Promoters

Holder% (Mar 2026)
Promoters (Hazel Infra Ltd)89.90
FIIs0.60
DIIs2.05
Public7.44

Hazel Infra is the holding vehicle 99% owned by Swan Corp’s promoter family (Merchants and Patels). Swan Corp itself is a conglomerate spanning textiles, real estate, oil & gas, tech, and shipbuilding.

Promoter Brief: The Merchant family and their extended network have deep industrial roots dating back to the 1900s. Swan Corp claims ₹4,900 crore in revenue (FY25) across all arms. The shipyard is a strategic asset within a broader portfolio.

Governance Note: Hazel Infra has been slowly diluting: it held 94.91% as of Dec 2024 and sold down to 89.90% by Mar 2026 (a 5% loss). This is partial monetisation, not abandonment. The promoter family remains firmly in control, but they are taking tactical exits to raise cash or rebalance.

Public Float: At 7.44%, public holding is thin. Institutional ownership (FII + DII) is negligible. This is a highly concentrated, family-held asset with minimal public equity base. Retail participation is sparse.


13 — Corporate Governance: Angels or Devils?

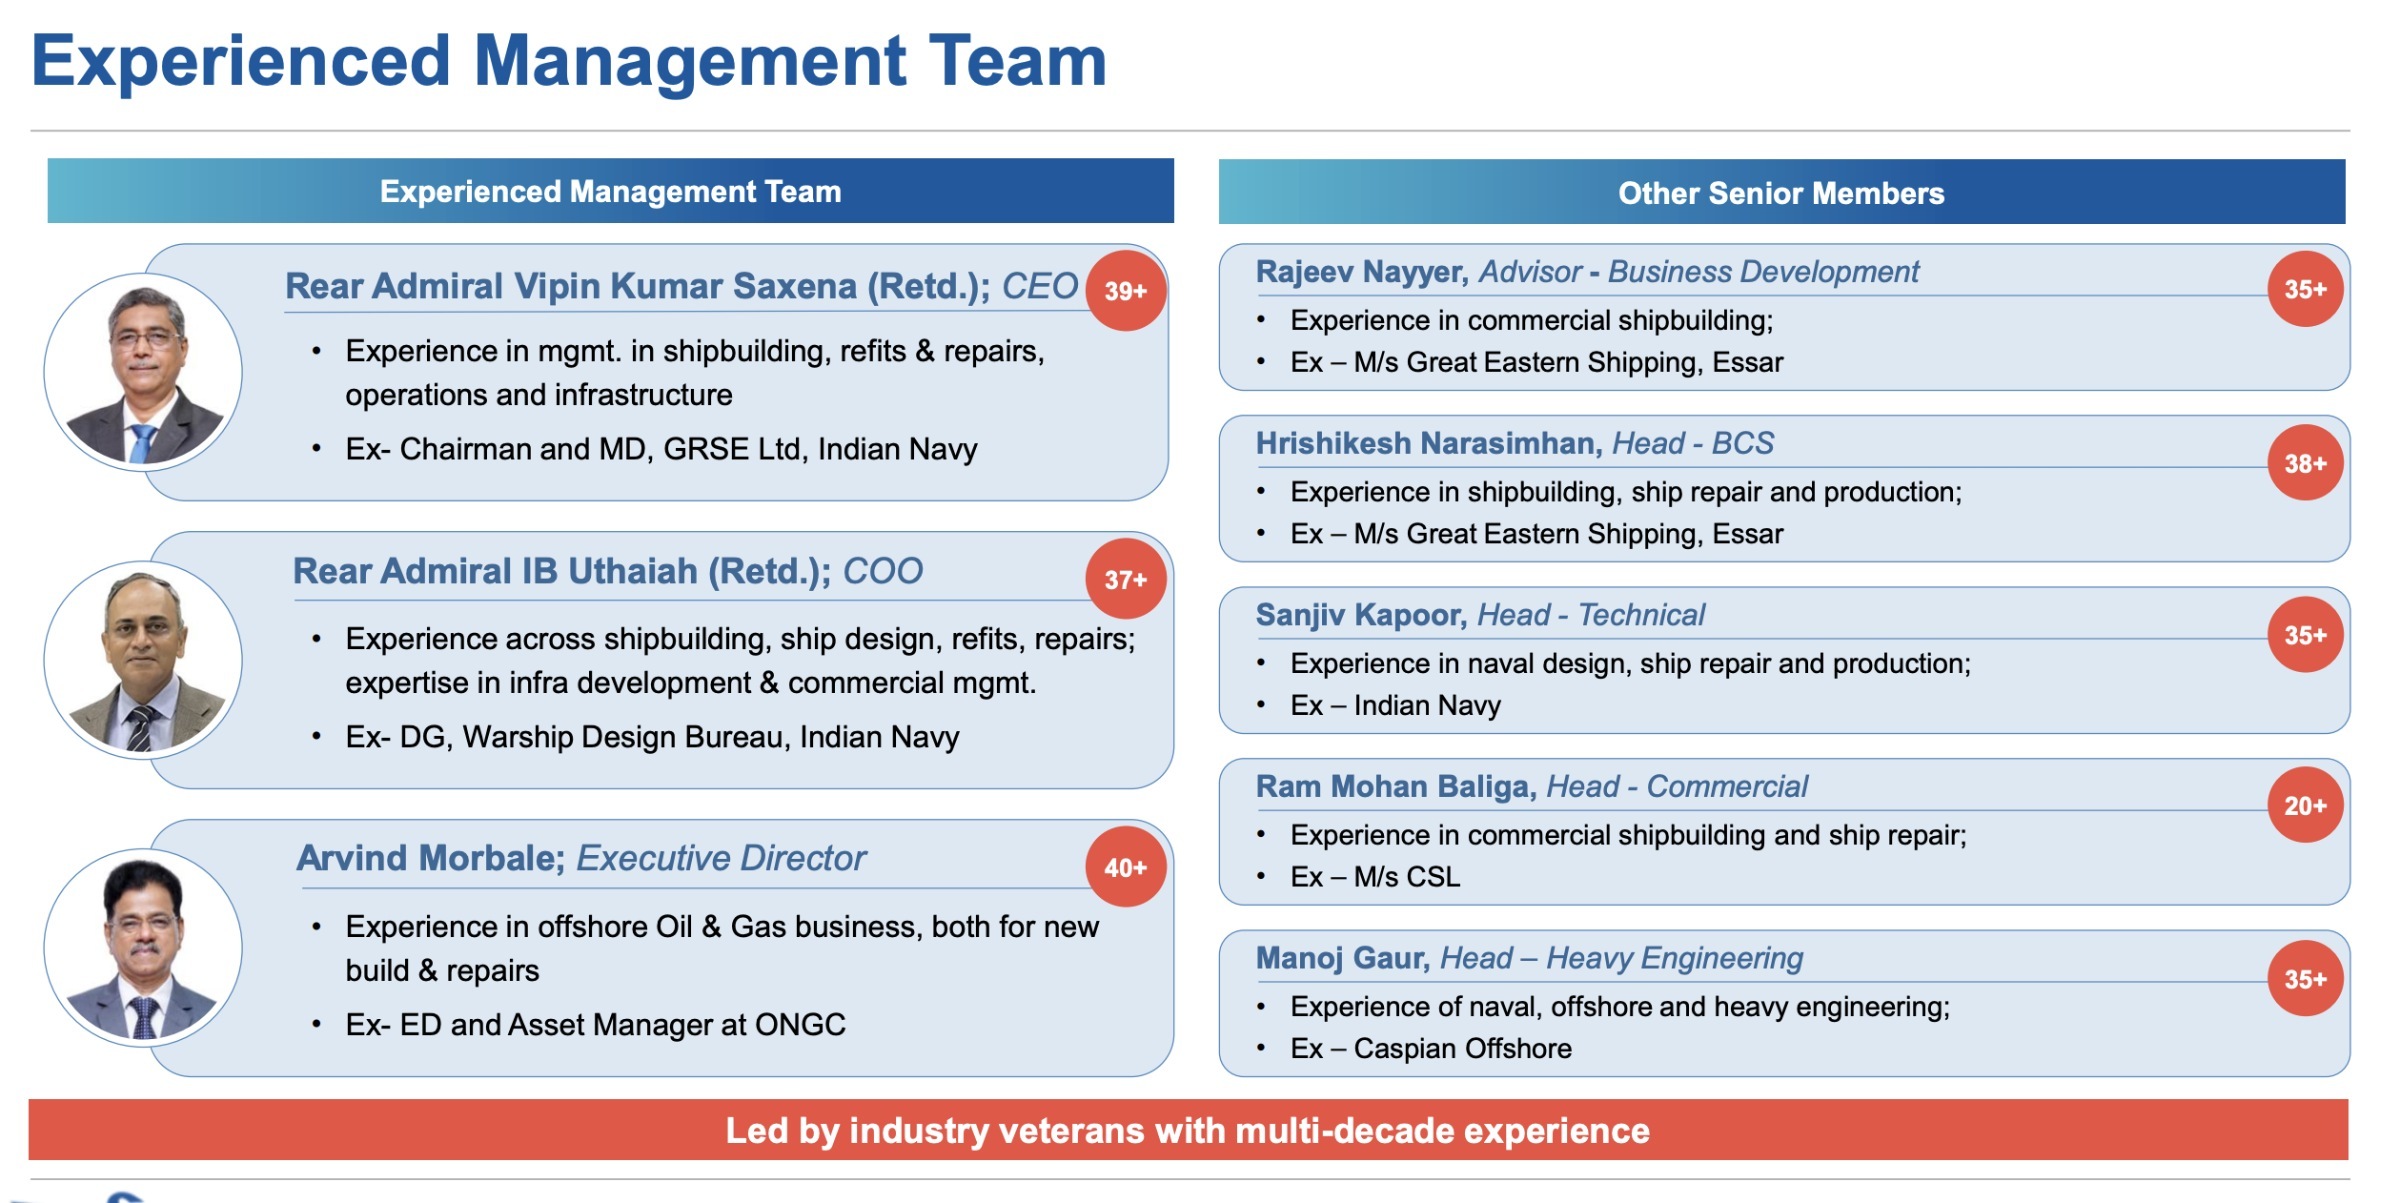
Board & Management: Rear Admiral Vipin Kumar Saxena (retired, Indian Navy) is CEO with 39+ years in warship design and build. Rear Admiral IB Uthaiah (retired, Indian Navy, ex-Director of Warship Design Bureau) is COO. Multiple senior hires are ex-Essar, Great Eastern Shipping, ONGC, and CSL—operational shipbuilding talent.

The board carries fresh leadership post-CIRP. This is a net positive: the Reliance-era mismanagement is gone; institutional naval expertise is in place.

Pledging: Pledged shares: 0%. Hazel Infra is not collateralising its holding. This is a green flag on promoter conviction.

Related-Party Transactions: The Triumph Offshore amalgamation (May 2026) is a related-party consolidation within Swan Corp’s ecosystem. Details on pricing and terms will live in the detailed scheme documents (filed with NCLT). The move looks like a group restructure, not a value-drain on Swan Defence, but the incentive alignment warrants disclosure scrutiny.

Governance Red Flags: None rising to urgent level. Auditors (Deloitte Haskins & Sells and Ernst & Young) are Tier 1 firms. The company files its results on time. NCLT oversight is behind (the CIRP concluded in late 2023; Swan took possession Jan 2024). Covenant compliance (on the ₹2,788 crore debt) is not yet a public issue, but watch for covenant waiver announcements as indicators of stress.

Tax: FY26 shows ₹0 in tax provision (loss carry-forward rules in India exempt loss-making companies from current tax). This is standard and not a dodging signal.


14 — Industry Roast & Macro Context

Global Shipbuilding: The industry is printing money in East Asia. South Korea and Japan lead on commercial builds; China dominates volume and cost. India’s share of global shipbuilding is <1% despite handling 95% of trade via sea routes. The irony is structural: foreign yards have decades of scale, automation, and supply-chain integration. Indian yards are now catching up, but it takes 5–10 years of sustained orders to crack the puzzle.

Government Support: New India is waking up. The Maritime India Vision 2030 targets ₹20,000+ crore in investment and 500k+ GT annual production by 2030. Capital support ranges from 15–25% of vessel cost depending on size and type. The scheme is real; the deployment is inconsistent (bottlenecks in project finance, insurance, and buyer offtake).

Domestic Demand: PSU shipbuilding demand is mandated: Shipping Corporation of India, oil PSUs, and coal PSUs have ~112 vessels (~$10 billion) to order over the next decade. This is Swan’s near-term anchor. Execution matters more than order size; delays or rework kill margins.

Pricing Wars: Chinese yards undercut everyone on price (cheap labour, subsidised credit, no profit motive on state yards). Indian yards must compete on quality, speed, and specialisation. Swan’s play is complex vessels (ammonia carriers, special rigs, offshore structures), not commodity bulk carriers. That’s the right niche—but execution has to be flawless.

Repair Opportunity: The ship repair market is smaller but higher-margin. Ageing fleets + regulatory conversions create steady inbound. Swan’s ONGC-approved offshore yard is well-positioned here. This is the first cash-generative leg while builds mature.

Macro Tailwind: Decarbonisation and ship lifecycle renewal could push global demand up 3–5% annually over the next decade. India is a beneficiary if it can scale. Swan, with government backing and a capable team, has a real shot. But the window is tight—15–20 years before the global fleet fully transitions to green fuel and automation flatten demand again.


15 — EduInvesting Verdict

SWOTDetails
StrengthsLargest dry dock in India (662m × 65m). 164,000-MT fabrication capacity. ONGC-approved offshore facility. Institutional management (retired admirals, shipbuilding ops veterans). Strategic partners (MDL, GRSE, Samsung, IHC, Fincantieri). Government PSU demand anchor.
WeaknessesUnprofitable (₹226 cr loss FY26). Negative equity trajectory. D/E ratio 39.8x. ₹2,788 crore debt burden. Fixed-cost base requires 50%+ utilisation to breakeven. Tiny order backlog relative to capacity.
Opportunities₹20,000 cr government shipbuilding capex (Vision 2030). $10 bn PSU ship orders over next decade. Ammonia carrier market expanding (regulatory tailwind). Ship repair market growing 20%+ annually. Offshore wind + oil & gas fabrication ramp. Capacity expansion (second dry dock, upgrades) positioned for 2027+ delivery pipeline.
ThreatsChinese shipyard pricing undercut. Global recession could defer PSU/commercial orders. Execution risk (first builds out of new management could slip, inflating costs). Debt covenant breach if cash burn doesn’t reverse by FY27. Related-party transactions (Triumph merger) could dilute shareholder value if mispriced. Equity dilution from ₹4,000 crore fundraise.

Closing Observation:

A state-of-art dry dock with a management team that knows its craft does not solve the problem of filling it. Swan Defence inherited infrastructure and lost nothing there. What it must deliver is a predictable stream of profitable orders executed on time and budget.

FY26 showed the ramp beginning. FY27 will show whether the ramp is real or a mirage. The four ammonia carriers and the repair pipeline are the next 18 months of proof. Profitability is 2–3 years away at best; solvency (can it carry debt without covenant waiver?) is a 12–18 month watch.

A balance sheet with nothing to hide, a multiple with everything to prove.


Prices referenced are not live (as of 5 June 2026). All figures consolidated, in ₹ crore unless stated.
