General information and entertainment, not investment advice. The author is not a SEBI-registered adviser or research analyst. No recommendation, no promised returns. Markets carry risk including loss of capital. Figures may not be current. Consult a registered adviser before acting.
1. At a Glance
Izmo posted its strongest quarter on record: ₹109.2 Cr revenue (+82% YoY), net profit ₹17.3 Cr (+151% YoY). The spike masks structural tension — much was project-led at Izmo Cars, with management freely admitting Q4 always carries OEM one-time work.
The larger machinery at work: Izmo Micro (the semiconductor packaging unit, currently 7% of revenue) is shifting from lab to order book. Management guided to ₹45–50 Cr revenue for FY27, out of a ₹18–19 Cr base in FY26. That’s a 2.5x step-up in one division.
Trade receivables spiked to ₹129 Cr from ₹99 Cr (165 days outstanding). Management said this is normal for the dealer/OEM cycle — money arrives in 4–5 months. But the question lingers: if core automotive is leveling off, where does the next leg come from? Izmo Micro is the answer management is betting on.
One tension shapes the read-through: core automotive revenue is stable, growing maybe 20% YoY; Izmo Micro is a startup inside a mature company, with billions of rupees of capex needed. Both paths are real. Management guided margin recovery to 20–25% EBITDA for FY27.
2. Introduction
Izmo Ltd, founded in 1995, runs three automotive software/services verticals and one early-stage semiconductor-packaging arm. The company is profitable, exports 87% of revenue, and operates in 22 countries via offices in Bangalore, Paris, Brussels, Long Beach, San Francisco, and Chicago.
The stock has run hard—up 201% in one year, 55% over three years. At ₹917 per share (prices referenced are not live), the market is now pricing in the Izmo Micro growth story. Management recently picked up Geronimo Web (UK), a digital marketing platform for auto dealers, expanding OEM footprint in Central Europe. The company also launched an AI factory internally and struck partnerships with IIT Madras, CCRAFT (Switzerland), and Alcyon Photonics (Spain) on advanced photonic packaging.
Dividend payout remains zero. Promoters hold 34.8%, up from 28% in 2022 (and tracking toward 39% via warrant conversion).
3. Business Model: WTF Do They Even Do?
Three segments carry Izmo’s legacy cash:
Izmo Studio (51% of Q4 FY26 revenue): CGI, 3D virtual showrooms, animated inventory. The company owns the world’s largest rights-managed automotive image library. Clients: Hertz, Avis, Europcar, Sony PlayStation. This is subscription revenue, sticky, 2% customer churn. It’s the machine that funds everything else.
Izmo Cars (26% of Q4 FY26): Digital retail platform + CRM for parts distribution. Operates in 22 countries, serves 3,000+ dealers. This business includes OEM projects (hence the Q4 lumpiness—one large deal can swing a quarter). Management acknowledged “normally done in Q4 of our financial year.”
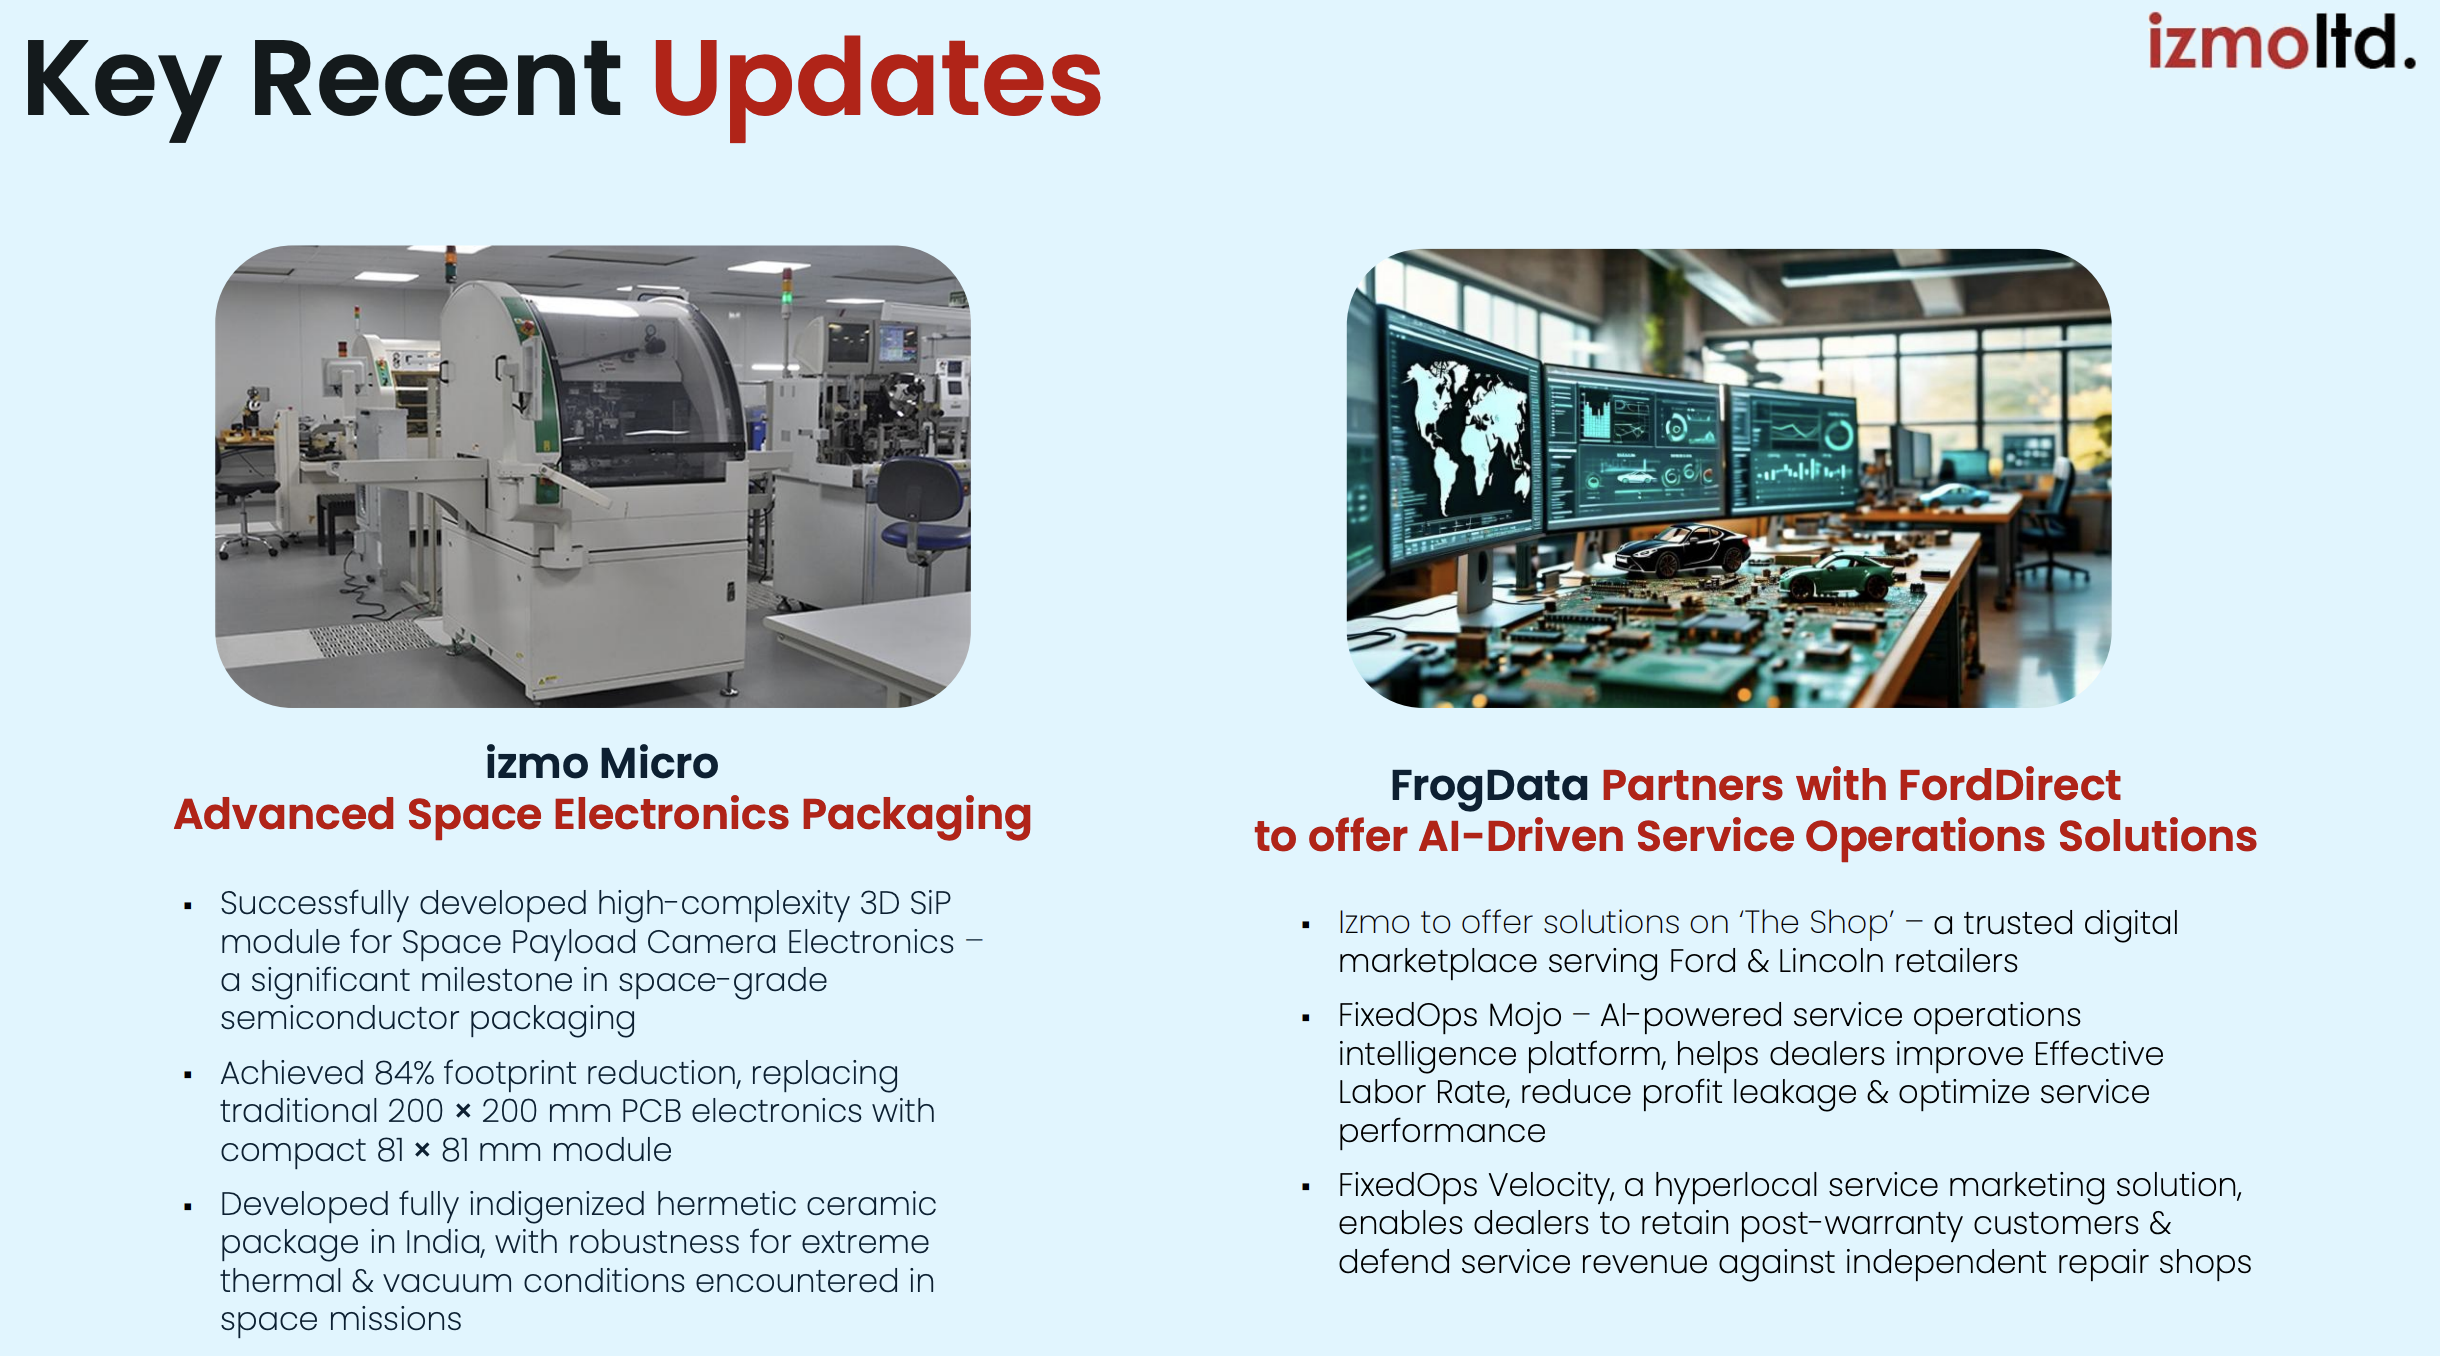
FrogData (14% of Q4 FY26): AI-driven dealer analytics. Decision intelligence platform for used car pricing, parts velocity, service labor optimization. Growing 50% YoY (per prior commentary). Recently launched FixedOps Mojo and FixedOps Velocity, hyper-local service marketing tools. Gross revenue retention is 98.5%, and the company just partnered with Ford to offer solutions through Ford’s e-commerce dealer shop.
Izmo Micro (9% of Q4 FY26, ~₹10 Cr annualized): Semiconductor packaging for advanced modules, silicon photonics, space/defense electronics. This is the new leg. In August 2025, it developed a 32-channel photonics package with insertion loss under 2 dB and 70 GHz performance. Tier 1 defense clients, IIT Madras partnership, European alliances. Order book reported as ₹40–60 Cr depending on which answer management gave.
Geography is shifting: North America is now 67% (up from 55% in FY23), Europe 20% (down from 23%), India 13% (down from 22%). The US is the growth engine; India-centric operations are being harvested.
4. Financials Overview
Figures are consolidated, in ₹ crore.
Metric
Q4 FY26
Q4 FY25
YoY %
Q3 FY26
QoQ %
Revenue
109.16
59.81
+82.5
59.11
+84.6
EBITDA (excl. other income)
14.83
12.09
+22.7
14.08
+5.3
PAT
17.30
6.89
+151.1
11.70
+47.9
EPS (₹)
11.56
4.63
+149.7
7.83
+47.6
The revenue surge is real but hollow: EBITDA margin fell from 20.2% in Q4 FY25 to 13.6% in Q4 FY26 (a 660 bps drop). Management explained this was deliberate — they prioritized the top line and incurred ₹69 Cr of “other costs” (outsourced delivery, third-party work, marketing expense for Izmo Micro). These costs are expected to normalize next quarter.
PAT margin recovered to 15.9% despite the operational margin squeeze, thanks to ₹6.5 Cr of other income (likely one-time gains or revaluations).
Quarterly sequence (last 5 quarters):
Q
Revenue
EBITDA excl OI
EBITDA Margin
PAT
EPS
Q1 FY26
56.51
9.70
17.1%
6.03
4.03
Q2 FY26
60.11
13.50
22.5%
12.56
8.43
Q3 FY26
59.11
14.08
23.8%
11.70
7.83
Q4 FY26
109.16
14.83
13.6%
17.30
11.56
Revenue plateaued at ₹59–60 Cr in Q1–Q3, then doubled in Q4. Operating leverage flipped. Management is guiding for normalization but described Q4 as “the highest quarterly revenue in the company’s history.”
Management Commentary (from concall): Management stated they “didn’t really care about the margin” in Q4, focused on proving revenue scale and absorbing Izmo Micro setup costs. FY27 guidance: 20–25% EBITDA margin, with higher margins as Izmo Micro scales and cost structure absorbs fixed overhead.
5. Valuation Discussion: Fair Value Range (Educational Only)
What follows is a walkthrough of how three valuation methods work, using this company’s numbers as the example — not a target, not a forecast, not advice.
Method 1 (P/E): Annualised EPS is ₹31.89 (FY26 full-year figure, no multiplication needed as this is annual). The automotive software/SaaS peer band trades at 19.75x–51.08x earnings. Applying the range: 31.89 × 19.75 = ₹630 | 31.89 × 51.08 = ₹1,629. Method 1’s arithmetic produces a range of ₹630–₹1,629.
Method 2 (EV/EBITDA): EBITDA (excluding other income) for FY26 is ₹66.84 Cr. Enterprise Value is approximately ₹1,368 Cr (market cap ₹1,373 less net cash ~₹5 Cr). Current EV/EBITDA is 20.5x. Peer band EV/EBITDA ranges 13.37–37.50x. Applying the range: 66.84 × 13.37 = ₹893 Cr EV | 66.84 × 37.50 = ₹2,507 Cr EV. Back out net debt (negligible), divide by shares (1.5 Cr): ₹595–₹1,671 per share. Method 2’s arithmetic produces ₹595–₹1,671.