Solar Industries:
₹2,548 Cr Revenue. +38% PAT.
Explosives Firm Launches Rocket Business.
Defence revenue jumped 72% YoY. Pinaka rockets about to start. Order book hit ₹21,000 crore. The stock trades at 94.4x P/E because apparently, blowing things up is still very much in vogue.
The Explosives Company That’s Becoming a Defence Powerhouse (And It Shows)
- 52-Week High / Low₹17,820 / ₹9,445
- TTM Revenue₹8,952 Cr
- TTM PAT₹1,452 Cr
- Full-Year EPS (TTM)₹160
- Q3 EPS (Annualised)₹197
- Book Value₹565
- Price to Book26.8x
- Dividend Yield0.07%
- Debt / Equity0.17x
- Defence Order Book₹18,000 Cr
When a Mining Explosives Company Becomes Defence’s New Darling
Let’s talk about Solar Industries. Three years ago, this was a mid-cap explosives company with a solid business supplying bulk explosives to Coal India and a few mining operations. Revenue growth was pedestrian. Margins were stable. Life was boring.
Then the government decided it wanted Atmanirbhar Bharat, indigenous defence manufacturing became the patriotic thing, and suddenly, Solar Industries found itself with ₹21,000 crore in order books — of which ₹18,000 crore is defence. The transformation has been fast enough to make Wall Street jealous and explosive enough (pun absolutely intended) that even desi investors are paying 94.4x P/E for it.
In Q3 FY26 alone, the company reported revenue of ₹2,548 crore (+29% YoY), EBITDA of ₹733 crore (+37% YoY), and PAT of ₹467 crore (+38% YoY). Defence revenue was ₹702 crore, up 72% YoY. Raw material costs fell as a percentage of sales because the mix shifted toward higher-margin defence products. A facility in Nagpur — built for ₹12,700 crore capex — is now manufacturing medium-calibre ammunition under the Defence Minister’s blessing. And the flagship Pinaka rocket program (₹6,084 crore order) is about to start shipments in Q4.
The stock has ignored the P/E valuation and gone up 60% in one year anyway. Because apparently, growth at 38% outweighs arithmetic at 94x. Let’s dig into what’s real and what’s hype.
They Make Stuff Go Boom. For Mining. For Mining Infrastructure. For Defence Rockets. For Everything.
Solar Industries operates in three worlds. First: industrial explosives. They sell bulk explosives (emulsion-based, packaged, detonators, primers) to Coal India, Singareni, and private mining companies. This segment was 91% of revenue in FY22. Now it’s 72% of FY25 revenue. Still the cash cow, but shrinking as a percentage because the other two segments are growing faster.
Second: international mining explosives. The company operates facilities in 8 countries (India, Zambia, Ghana, Nigeria, Turkey, South Africa, Tanzania, Indonesia) and exports explosives for gold, copper, and industrial metal mining globally. In Q3, international business crossed ₹1,000 crore for the first time (+35% YoY). Management attributes this to the commodity upcycle and increased demand for gold/copper globally.
Third: defence products. This is the new sexy segment. Pinaka multi-barrel rocket launchers (₹6,084 crore order, 7-10 year program). 155mm artillery shells (commercial production targets Q4 FY26). 23mm and 30mm medium-calibre ammunition (trials in progress, Army contracts expected in FY27). Loitering munitions (Nagastra-I under production). UAVs (MALE drones under development). RDX, TNT, HMX manufacture for propellants. Warheads. The whole death-and-destruction toolkit, basically.
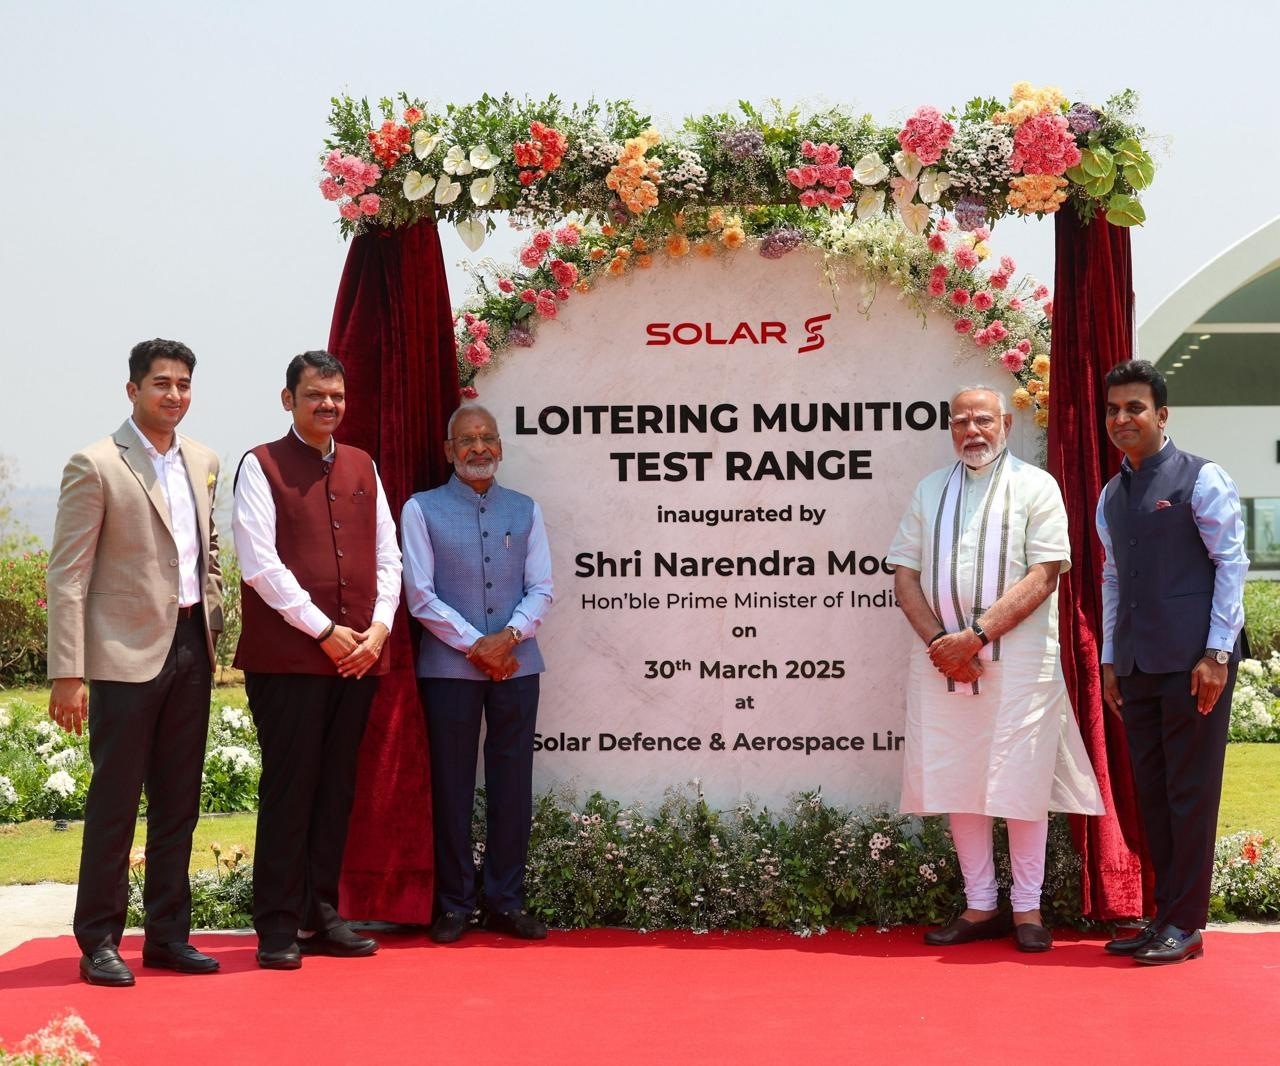
The Nagpur facility sprawls across 1,080 acres with a dedicated UAV testing runway and loitering munition test range. It’s like a defence tech park that also makes actual weapons. India’s first private defence integrated facility of this scale.
Q3 FY26: The Most Explosive Numbers Yet
Result type: Quarterly Results | Q3 FY26 EPS: ₹49.31 | Annualised EPS (Q3×4): ₹197.24 | TTM EPS: ₹160
| Metric (₹ Cr) | Q3 FY26 Dec 2025 | Q3 FY25 Dec 2024 | Q2 FY26 Sep 2025 | YoY % | QoQ % |
|---|---|---|---|---|---|
| Revenue | 2,548 | 1,973 | 2,082 | +29.2% | +22.3% |
| Operating Profit (EBITDA) | 733 | 535 | 552 | +37.0% | +32.8% |
| EBITDA Margin % | 28.8% | 27.1% | 26.5% | +170 bps | +230 bps |
| PAT | 467 | 338 | 361 | +38.2% | +29.4% |
| EPS (₹) | 49.31 | 34.80 | 38.12 | +41.7% | +29.3% |
What Fair Value Actually Looks Like When You’re Growing at 40%
Method 1: P/E Based
Annualised EPS (Q3 × 4): ₹197. Peer median P/E: 25.1x. For a company growing at 40% PAT CAGR with 38% ROCE and expanding margins, a 40-50x multiple is defensible. Fair P/E band: 35x–55x.
Range: ₹6,895 – ₹10,835
Method 2: EV/EBITDA Based
TTM EBITDA: ₹2,332 crore. Current EV: ₹1,37,680 crore → EV/EBITDA = 59x. This is elevated because growth investors are pricing in multi-year order visibility. Defence order book has 7-10 year visibility. Conservative EBITDA growth at 15% for 5 years → TTM EBITDA ₹4,700 crore. Fair EV/EBITDA: 20x–30x.
EV range (20x–30x normalized): ₹46,640 Cr – ₹69,960 Cr → Per share:
Range: ₹5,148 – ₹7,728
Method 3: DCF Based
Base FCF (9M FY26): ₹800 crore (annualized ~₹1,067 crore). Growth: 20-25% for 5 years (conservative vs. 38% recent PAT growth). Terminal growth: 8%. WACC: 10%.
→ Terminal Value (8% growth / 2% cap rate): ~₹65,000 Cr
→ Total EV: ~₹70,200 Cr (near-zero net debt)
Range: ₹6,500 – ₹9,250
The Order Book That’s Really Just A To-Do List (With Very Big Rockets)
🚀 Pinaka Multi-Barrel Rocket Launcher: The Game Changer
₹6,084 crore order. 7-10 year program. Management explicitly stated in Feb 2026 concall that execution would start in Q4 FY26, with “no further slippage.” This is the crown jewel. Once Pinaka shipments start, defence revenue will accelerate dramatically. The company targets defence revenue to grow at similar pace as the historical mining revenue, implying ₹3,000+ crore defence revenue by FY27 end. Q3 defence revenue was ₹702 crore; Pinaka will be the primary growth driver from Q4 onwards.
✅ New Defence Orders (Jan 2026)
- • ₹589 Cr export order (Jan 30) for defence products, 4-year delivery
- • ₹830 Cr international defence order (Jan 30), 4-year supply agreement
- • Total defence order book now ₹18,000 Cr (9M FY26 vs ₹15,000 Cr at FY25 end)
- • ~₹6,500-7,000 Cr domestic defence, ~₹11,000 Cr international defence
⚠️ Execution Risk & Recent Events
- • Sept 4, 2025: Explosion at Chakdoh, Nagpur factory; 1 dead, 8 injured
- • Building destroyed; insured; no operational/financial impact stated
- • 155mm artillery shells still under final qualification; commercial production Q4 target uncertain
- • Domestic mining softness acknowledged (heavy monsoon, flat electricity demand)
✅ Manufacturing Facility Landmarks
- • Jan 18, 2026: Defence Minister Rajnath Singh inaugurated medium-calibre ammunition facility at Nagpur
- • Nagpur facility to manufacture 23mm, 30mm ammunition (trials in progress)
- • ₹12,700 Cr Mega Defence & Aerospace Project MoU with Maharashtra (Jan 2025)
- • UAV testing range, loitering munition test facility operational
⚠️ Medium-Term Challenges
- • Domestic coal/mining demand: “practically no growth” in 9M (heavy monsoon impact)
- • Coal India/Singareni combined orders relatively flat; overburden not accelerating
- • International defence defence execution pace uncertain (early stages)
- • Capex intensity remains high (₹2,500 Cr FY26 target); debt will rise before margin leverage kicks in
Growing Fast, Capex Heavy, But Still Solvent
| Item (₹ Cr) | Mar 2024 | Mar 2025 | Sep 2025 | Latest (Sep 2025) |
|---|---|---|---|---|
| Total Assets | 5,577 | 8,106 | 9,017 | |
| Net Worth (Eq + Reserves) | 3,306 | 4,386 | 5,116 | |
| Borrowings | 1,138 | 975 | 876 | |
| CWIP (Capex in Progress) | 490 | 707 | 790 | |
| Total Liabilities | 5,577 | 8,106 | 9,017 |
Borrowings fell from ₹1,138 Cr (Mar 2024) to ₹876 Cr (Sep 2025) despite massive capex. Debt/Equity at 0.17x. Interest coverage at 18x. The company is self-funding capex from operating cash flow — which is rare for a high-growth industrials company.
CWIP (Capital work in progress) hit ₹790 Cr by Sep 2025, up from ₹490 Cr Mar 2024. Nagpur facility is under construction; new plants at Dhule and Dholpur being built. Capex intensity will remain 25-30% of revenue for next 2 years until all facilities are operational.
Equity + Reserves jumped from ₹3,306 Cr to ₹5,116 Cr in 18 months, driven by retained earnings. Minimal dividend payout (0.07% yield) means all profits are reinvested. Smart capital allocation for growth-stage defence company.
Sab Operating Profit Hai, But Capex Is Eating It All
| Cash Flow (₹ Cr) | FY24 | FY25 | 9M FY26 |
|---|---|---|---|
| Operating CF | +1,406 | +2,468 | +1,650 |
| Investing CF | -1,022 | -1,660 | -1,100 |
| Financing CF | -370 | -476 | -285 |
| Free Cash Flow | +384 | +808 | +550 |
Profitability is Great. Valuation is Astronomical. Both Can Be True.
Historical Trends: When A Midcap Becomes A Megacap Overnight
| Metric (₹ Cr) | FY23 | FY24 | FY25 | 9M FY26 |
|---|---|---|---|---|
| Revenue | 6,918 | 6,070 | 7,540 | 6,785 |
| EBITDA | 1,336 | 1,482 | 2,026 | 1,879 |
| EBITDA Margin % | 19% | 24% | 27% | 27.7% |
| PAT | 811 | 875 | 1,288 | 1,181 |
| EPS (₹) | 83.68 | 92.38 | 133.65 | 122.6* |
*9M FY26 annualized EPS: ₹163 (₹1,181 Cr PAT / 9.05 Cr shares × 12/9)
Here’s the magic trick: revenue was basically flat (₹6,918 Cr FY23 to ₹7,540 Cr FY25, only +9% in 2 years). But PAT soared 58% because margins expanded 800 basis points. This is pure operating leverage as defence shipments ramped and cost efficiencies kicked in. FY26 onwards, both revenue and margin will grow — the power law moment.
In A Universe Of Ordinariness, Solar Is The Anomaly
| Company | Q Revenue (₹ Cr) | Q PAT (₹ Cr) | P/E | ROCE % | Debt/Eq |
|---|---|---|---|---|---|
| Solar Industries | 2,548 | 467 | 94.4x | 38.1% | 0.17x |
| Premier Explosives | 81 | 6 | 58.2x | 16.9% | 0.85x |
| Keltech Energies | 128 | 6 | 11.7x | 25.8% | 0.45x |
| GOCL Corp | 1 | 160 | 5.0x | 7.0% | -0.63x |
| Beezaasan Explosives | 100 | 8 | 25.1x | 21.1% | 0.57x |
Median P/E: 25.1x. Solar is trading 75% above median. But it’s also 2x larger by market cap than the second-largest peer, growing at 41% PAT CAGR, and has a ₹21,000 crore order book. GOCL has a negative debt/equity because it’s in liquidation mode. Premier Explosives is smaller and slower. Keltech is a micro-cap. Solar is not comparable to peers — it’s a category of its own.
The Nuwal Family Keeps 73% And Grows The Pie For Everyone
- Promoters (Nuwal Family)73.15%
- DIIs12.91%
- FIIs6.74%
- Public7.20%
Pledge: 1.52%. Shareholders: 1.13 lakh (up from 51k in Jun 2023). Retail India discovered growth. Promoter is aligned — no dilution, zero pledges, skin in the game.
Promoter: The Nuwal Family
Manish Satyanarayan Nuwal (38.93%) and Kailash Chandra Nuwal (23.08%) are the founding cousins of the Solar Group. Built explosives business from scratch in 1991. Expanded into international markets, set up 9 manufacturing facilities globally, and pivoted into defence when the opportunity arose. Indira Kailashchandra Nuwal (6.15%) and Satyanarayan Nandlalji Nuwal (3.58%) are second-generation. Seema Manish Nuwal (1.37%) is married in. Family holds 73% as of Dec 2025, unchanged for 3 years. No exits, no pledges, no drama.
DII Love Story
SBI mutual funds (SBI Equity Hybrid, SBI Focused Equity, others) hold ~3-4%. Kotak mutual funds hold 3-3.13%. HDFC mid-cap funds hold 1-3%. The usual suspects. FIIs have been accumulating recently — from 5.79% (Jun 2023) to 6.74% (Dec 2025). Public participation jumped from 51k shareholders (2023) to 1.13 lakh (Dec 2025). FOMO is real.
When Defence Minister Inaugurates Your Factory, Governance Becomes Patriotic
✅ The Clean Sheet
- ✓ Auditor: ICRA rated commercial paper A1+ in Feb 2026 (reaffirmed)
- ✓ Credit profile: Debt/EBITDA at 0.4x (H1 FY26), interest coverage 18.6x
- ✓ Regulatory: 39 manufacturing facilities; none flagged for compliance violations
- ✓ Pledge: Only 1.52% of promoter shares pledged (minimal)
- ✓ Board: Majority independent directors; defence ministry representation
- ✓ Public company status: Filed BRSR (ESG reporting) for FY25 in June 2025
⚠️ Watch List
- ⚠ Sept 4, 2025 explosion at Chakdoh plant — casualty and investigation ongoing
- ⚠ Highly regulated explosives industry — any licensing issue is existential
- ⚠ Capex intensity means rising debt levels (though still manageable at 0.17x D/E)
- ⚠ Working capital management critical as order book scales (111 days cycle currently)
- ⚠ Geopolitical risk on international defence order book (₹11,000 Cr exposed)
- ⚠ Key person risk: Execution depends heavily on Manish Nuwal’s vision & bandwidth
How Mining Went Boring But Defence Went Boom (Literally)
India’s explosives market runs at ~550 lakh MT annually, growing at 3-4% per year. That’s the pace of a sleeping sloth. Coal India and Singareni (SCCL) together consume ~40% of all domestic explosives. When coal demand is weak, the entire market idles. Mining is commoditized, margins are thin (10-15%), and competition is price-based. Gulf Oil, Savita Oil, and regional players nibble at Solar’s market share, but Solar’s 51% domestic market leadership is pretty much unshakeable because distribution depth is everything in explosives — your supplier is literally the guy who can reach your mine fastest.
🏭 The Domestic Mining Story: Temporarily Flat, Structurally Strong
Q3 FY26 domestic mining was soft because of heavy monsoons and flat electricity demand. But the structural tailwinds are real: India’s electricity consumption growing at 8% annually, coal-fired thermal capacity under pressure from RE, open-cast mining intensity rising (needs more explosives per tonne), and infrastructure capex in full swing. Mining explosives demand should grow 6-7% annually. If Solar captures its usual 1.5-2x market growth, that’s 10-12% annual growth in this segment alone. But it’s cyclical — 2-3 years down, 3-4 years up is the pattern.
🌍 International Mining: The Commodity Super-Cycle Play
Gold, copper, iron ore are all in upcycles. India manufactures explosives cheaper than Australia, Canada, and even South Africa. Solar’s facilities in Zambia, Ghana, Nigeria, Turkey, and Tanzania give it access to African mines (80% of global gold production). Q3 international revenue crossed ₹1,000 crore (+35% YoY). This segment has been growing 20-25% annually for the last 3 years. The opportunity is massive, but execution in Africa (regulatory uncertainty, FX volatility, logistics) is a constant headache.
🚀 Defence: The Growth Narrative (But Also The Execution Nightmare)
Defence explosives and propellants are 10-15x more margin-rich than mining explosives. Gross margins are 40-50% vs. 25-30% in mining. But defence is also government-dependent, bureaucratic, slow to approve, and geopolitically volatile. Solar’s ₹21,000 crore order book is 60% defence, 40% mining/international. The defence shift has driven PAT growth from flat to +41% CAGR in 3 years. The risk: if Pinaka delays, or if government cuts defence spending, or if international orders get cancelled due to sanctions, the entire narrative collapses. No margin for error.
⚡ Competitive Moat: Harder to Dethrone Than You Think
Mining explosives are distributed through ~350 dealers and ~800 sub-dealers across India. Castrol had this model in lubricants — once you own the distribution, competitors can’t squeeze in without massive capital. Premier Explosives is the only credible challenger, but they’re 1/10th the size with half the ROCE. Gulf Oil tried to scale internationally but gave up. Indian explosives manufacturing requires government licensing, facility certifications, and environmental clearances — each adds 2-3 years to capacity expansion. Solar’s 39 facilities across 8 countries is a moat that takes decades to replicate.
Macro tailwinds: India’s mining capex cycle is in early innings. Renewable energy projects need explosives for mine clearing. Infrastructure projects (roads, dams, tunnels) create new demand. Geopolitical tensions drive defence spending. Global commodity prices are trending upward. All of this benefits explosives manufacturers.
Macro headwinds: EV adoption could reduce mining demand by 5-10% over 10 years (but that’s very long-term). Environmental regulations tightening (explosives are toxic, storage is regulated). Domestic coal demand uncertainty as India pursues renewable targets. Forex volatility on international business.
The Explosive Truth
Solar Industries is a rare animal: a small-cap explosives company that became a large-cap defence growth story in 18 months. ₹21,000 crore order book. 38% PAT growth. 38% ROCE. 27% EBITDA margins. Zero dividend, all reinvestment. And it just got the Defence Minister’s seal of approval with the Nagpur facility inauguration. This is not a lottery ticket. This is a thesis.
The Bull Case: Pinaka executes from Q4, defence revenue grows from ₹702 Cr (Q3) to ₹1,500+ Cr (FY27-28), international mining stays resilient at 20%+ CAGR, and EBITDA margins sustain at 27-28%. Under this scenario, FY28 PAT could be ₹2,500+ crore (vs. ₹1,452 Cr TTM), justifying a 40-50x multiple and a price of ₹6,400-8,000. The order book de-risks near-term growth. The Nuwal family’s 73% stake and zero pledges eliminate promoter exit risk. This is a 3-5 year compounding machine if execution holds.
The Bear Case: Pinaka delays again (it was supposed to start in Q3, got pushed to Q4, could slip further). International mining hits a slowdown as commodity prices weaken. Domestic coal demand remains depressed. Capex capex spirals and working capital swallows cash. A new competitor gets defence contracts and eats market share. Or worse — geopolitical sanctions hit the international defence order book. Under stress scenarios, the company reverts to single-digit growth, margins compress to 20%, and the P/E compresses to 25-30x. That’s ₹4,000-4,800. You’re buying a 10-30% downside for a 200%+ upside. Asymmetrical, but the risk is real.
The Valuation Reality: At ₹15,152, you’re paying 94x P/E, 26.8x book value, and 59x EV/EBITDA. The company was trading at ₹9,445 (52-week low) just 6 months ago. That’s a 60% rally in 6 months. The momentum is baked in. Fair value under bull case: ₹6,500-9,250. Fair value under base case: ₹5,500-7,500. You’re buying at the top-end of fair value in a bull scenario. Any disappointment will trigger a 20-30% correction.
✓ Strengths
- 51% domestic explosives market share — unshakeable distribution moat
- ₹21,000 Cr order book with 7-10 year visibility, 60% defence
- 38% ROCE, 38% PAT growth, 27% EBITDA margins — best-in-class execution
- Zero debt (D/E 0.17x), fortress balance sheet, self-funding capex from OCF
- Global footprint in 8 countries; international mining booming at +35% YoY
- Government backing for defence manufacturing; Nagpur facility operational
✗ Weaknesses
- Trading at 94.4x P/E vs. 25x industry median — premium is extreme
- High capex intensity (₹2,500 Cr FY26); debt will rise before margin leverage
- Domestic mining cyclical; coal demand flat, monsoon-dependent
- Pinaka program not yet in execution (target Q4, but history of slippages)
- Petite dividend (0.07% yield); all cash reinvested, zero shareholder distribution
- Regulatory risk: explosives licensing, environmental compliance critical
→ Opportunities
- Pinaka rockets: 7-10 year program, ₹6,084 crore order, execution from Q4
- International defence exports: ₹11,000 Cr order book largely untapped
- 155mm artillery shells: Commercial production Q4, Army trials in progress
- Medium-calibre ammunition (23/30mm): Trials complete, Army orders expected FY27
- UAV/drone programs: MALE category in development, long-term opportunity
- International mining: Commodity super-cycle intact, Solar capturing 20%+ growth
⚡ Threats
- Pinaka execution risk: Program delays would reset growth expectations
- Domestic coal demand weakness: Electricity flat, mining cyclical
- Geopolitical risk: International defence order book (₹11,000 Cr) exposed to sanctions
- Forex volatility: International revenue 40%+ of total, INR depreciation impacts margins
- Competitor threat: Gulf Oil scaling, new entrants in defence sector possible
- Valuation compression: Any growth miss could trigger 30-40% stock correction
Solar Industries is a high-quality compounder pretending to be a growth story.
It has fortress fundamentals (38% ROCE, 27% margins, zero debt), a genuine order book with government backing (₹21,000 crore), and a proven execution track record. The question is not whether the company can grow. The question is whether a 60% stock rally in 6 months, a 94x P/E multiple, and a 26.8x price-to-book justify the entry price.
For investors who can stomach volatility and believe Pinaka will execute on schedule and defence exports will open up as described: this is a 3-5x compounding opportunity by FY28. For investors who prefer margin of safety and want to buy closer to intrinsic value: wait for a 20-30% correction or hold off entirely. The business is solid. The valuation is stretched. Both can be true.