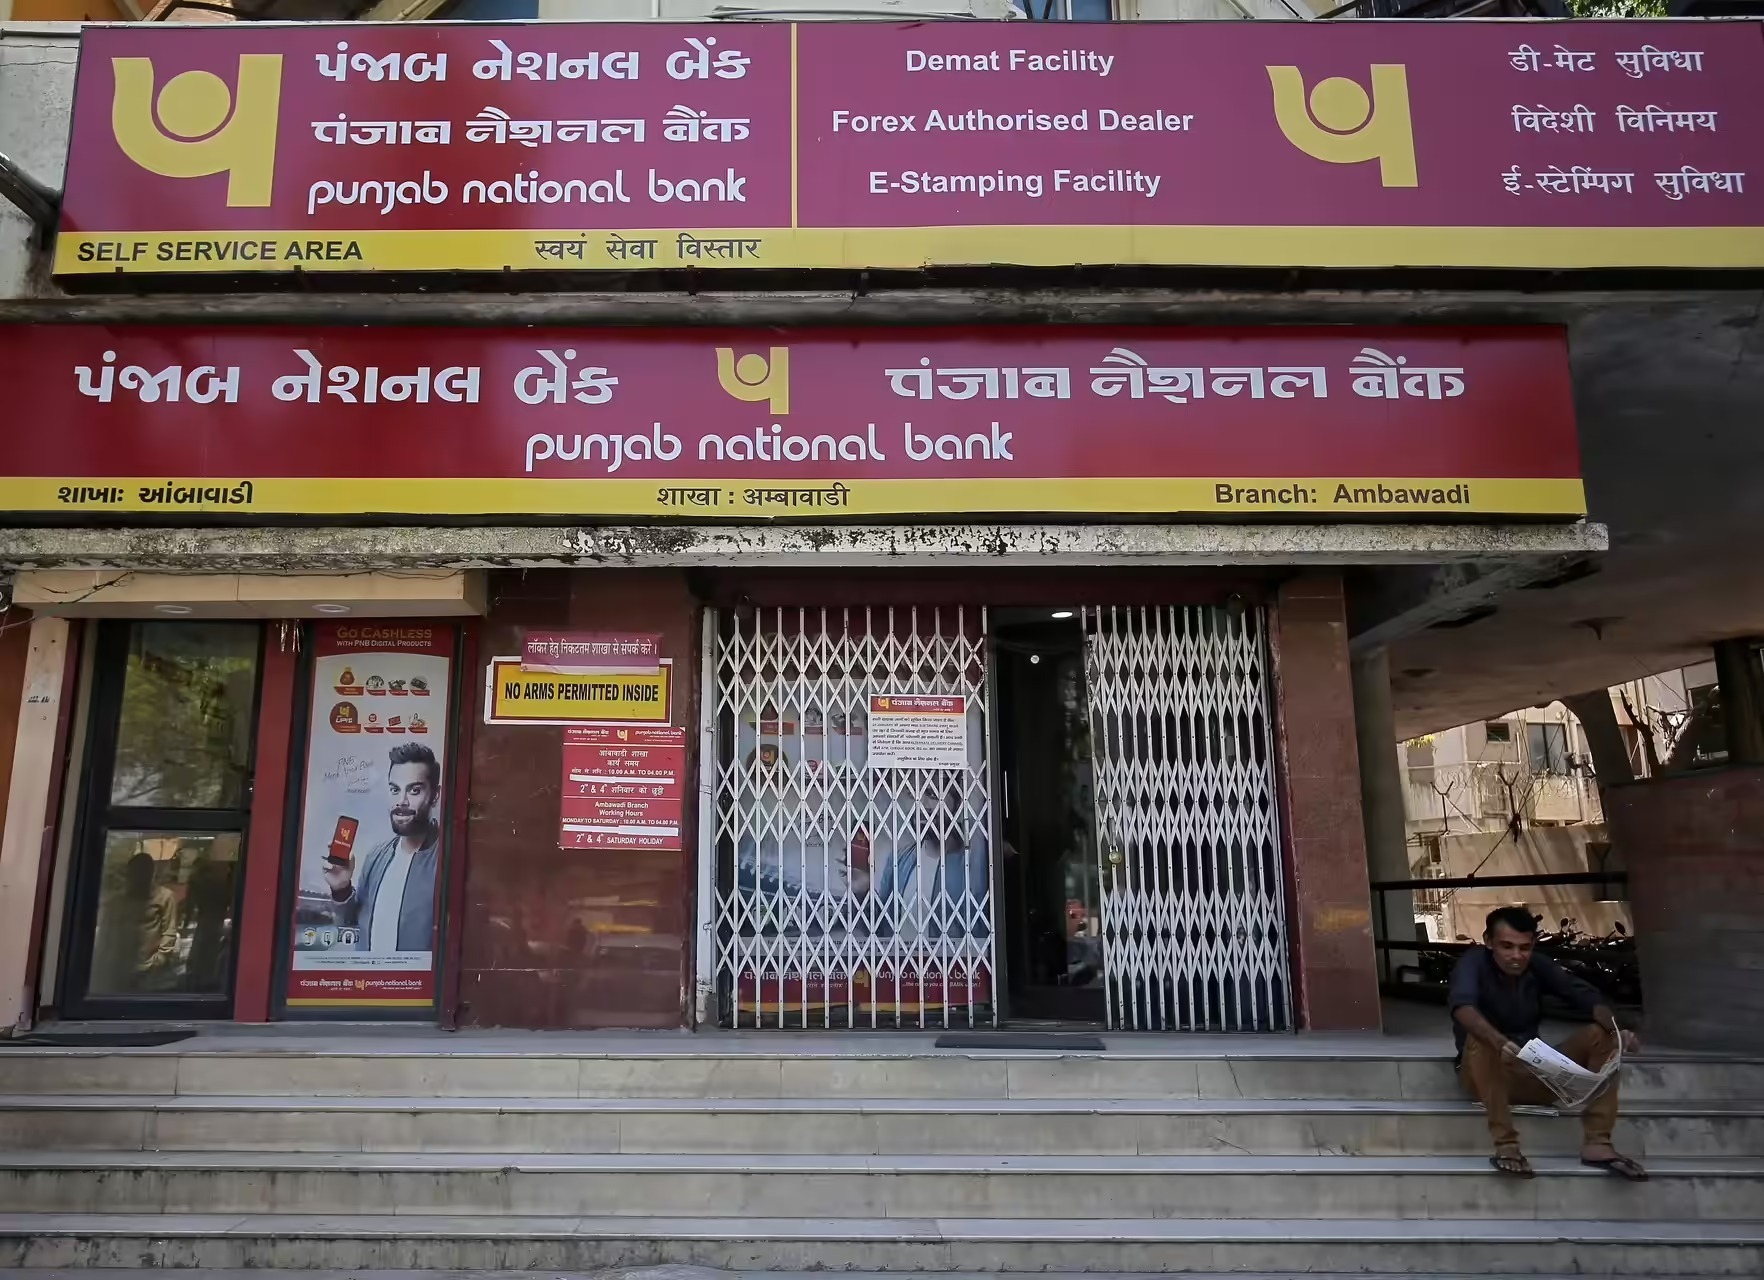
Punjab National Bank:
₹5,100 Cr Profit. 17.8% ROE.
The Underdog PSU Printer Running Hot
Third-largest PSU bank just posted its strongest quarterly profit in years. Asset quality at a decade-high. Management pre-funding for ECL transition. Stock still trades below book value. Welcome to the greatest arbitrage nobody is talking about.
A ₹5,100 Cr Surprise from the Government’s Third-Largest Bank
Government holds 70.08% | Quarterly results show strong operational momentum | Management explicitly building ECL buffers ahead of regulatory transition | Stock return YTD: +14.5%. Return 6M: +0.8%. Trading well below peers at 0.92x book value.
- 52-Week High / Low₹135 / ₹85.7
- Q3 FY26 Revenue₹32,889 Cr
- Q3 FY26 PAT₹5,100 Cr
- Q3 EPS (₹)4.83
- Annualised EPS₹19.32
- Book Value / Share₹130
- Price to Book0.92x
- Dividend Yield2.43%
- Debt / Equity12.0x
- ROE (12M)17.8%
The PSU Bank Nobody Expected to be Competent
Punjab National Bank. Founded 1895. Swallowed two other PSU banks (Oriental Bank of Commerce and United Bank of India) in 2020. And then spent the next 5 years doing what nobody expected from a government-owned lender: systematically fixing its mess and printing cash.
Most PSU banks are the comedy routines of Indian finance — bloated balance sheets, asset quality as predictable as Indian monsoons, and dividend policies written by someone’s uncle. PNB? Different story. Management has spent the last three years on a silent mission to reduce NPAs from 11.78% (FY22) to 3.19% (Q3 FY26). Recovered ₹30,500 crore from NPAs in three years. Building provisions like it owes money to a very angry personal finance influencer. And nobody, and I mean nobody, is paying attention.
The latest Q3 FY26 concall was masterclass-level nuance. Management explicitly discussed pre-funding provisions for the April 2027 ECL transition. Gave detailed SMA breakdowns. Talked about repricing timelines for deposit schemes. Conceded that NIM compression is real but quantified the relief pipeline. This is not typical PSU communication. This is a bank that learned to read a balance sheet.
The stock trades at 0.92x book value. P/E of 7.71x. And 17.8% ROE. If you believe this bank continues its underwriting improvement trajectory — and the data suggests it will — this is an absurd valuation.
A Bank in the 19th Century Tradition: Simple and Profitable
PNB has 70.08% government ownership. The business is simple: take deposits, lend to corporates/SMEs/retail, rake in spreads, maintain provisions, distribute whatever’s left. Nothing revolutionary. Just boring, scalable profitability.
The bank operates 10,228 domestic branches (63.3% in rural/semi-urban areas), 11,187 ATMs, and 32,278 business correspondents. Distribution depth. The advances mix is: Retail 25%, Agriculture 17%, MSME 15%, Corporate 43%. This is a balanced credit portfolio. The deposits mix is: Term Deposits 63%, Savings 32%, Current 5% — a sticky liability base.
Global business (deposits + advances) stands at ₹27.87 lakh crore, up 11.11% YoY as of September 2025. The bank is growing deposit base methodically, CASA ratio at 37.29% (lower than peers but stable). CD ratio at 74.2%, well-managed. This is not a bank taking insane risks. This is a bank systematically growing its balance sheet in a disciplined manner.
Q3 FY26: The Numbers That Should Matter More
Result type: Quarterly Results | Q3 FY26 EPS: ₹4.83 | Annualised EPS (Q3×4): ₹19.32 | TTM EPS: ₹15.47 (from annual P&L)
| Metric (₹ Cr) | Q3 FY26 Dec 2025 | Q3 FY25 Dec 2024 | Q2 FY26 Sep 2025 | YoY % | QoQ % |
|---|---|---|---|---|---|
| Revenue | 32,889 | 31,895 | 32,513 | +3.1% | +1.2% |
| Operating Profit | 7,481 | 6,612 | 6,606 | +13.1% | +13.2% |
| OPM % | 23% | 21% | 20% | +200 bps | +300 bps |
| PAT | 5,100 | 4,505 | 4,739 | +13.2% | +7.6% |
| EPS (₹) | 4.83 | 4.18 | 4.10 | +15.6% | +17.8% |
What’s This Bank Actually Worth?
Method 1: P/E Based
Annualised Q3 EPS = ₹19.32. TTM EPS = ₹15.47. For a bank with 17.8% ROE and systematically improving asset quality, justified P/E = 10x–12x. PSU banks normally trade 8x–11x. PNB’s improvements suggest 10x–12x is reasonable.
Range (TTM basis): ₹155 – ₹186
Method 2: P/B Based
Book Value per share = ₹130. Current P/B = 0.92x. Historical median P/B for PSU banks = 1.0x–1.2x. If PNB re-rates to 1.1x P/B on consistent execution, target = 1.1 × ₹130.
Range: ₹143 – ₹156
Method 3: RoE Implied Valuation
17.8% ROE with stable/improving trajectory. Growth rate 7–9% internally. Risk-free rate ~6.5%. Equity risk premium ~6%. Implied cost of equity ~12.5%. Using Gordon Growth: Value = Book Value × (ROE – Growth) / (CoE – Growth).
→ ~₹130 × 9.8% / 4.5% ≈ ₹283 (very simplified; banks are different animals)
Conservative Range: ₹150 – ₹180
The Insider Scoops That Make Banking Boring
✅ The Big One: Management’s ECL Pre-Funding is Actually Smart
From April 1, 2027, Indian banks transition from Incurred Loss to Expected Credit Loss (ECL) accounting. PNB is pre-funding via “floating provisions” — ₹1,775 crore as of Q3 FY26, up from ₹820 crore in Q2. Management explicitly stated: “conscious decision to make additional provision” to “minimize the impact of ECL.” This translates to ~₹500 crore/quarter incremental provision burden, phased across 5 years. Result: near-term profit hit, but medium-term earnings stability. This is the opposite of kicking cans down roads.
✅ Asset Quality: Actually at Decade-High
- • GNPA fell to 3.19% (Q3) from 4.09% (Dec 2024)
- • NNPA at 0.32% — lowest in recent memory
- • PCR (Provision Coverage Ratio) at 96.99%
- • Recoveries of ₹4,090 cr (2.2x slippages)
- • Fresh slippages: 0.56% annualized (target: below 1%)
⚠️ The Margin Squeeze: Not Forever Though
- • Domestic NIM compressed to 2.65% (Q3) from 2.93% (Q3 FY25)
- • Global NIM at 2.52% — under pressure
- • Reason: 50%+ of advances linked to repo rates (fast repricing on RBI cuts)
- • Deposit costs not falling fast enough (management kept rates high)
- • BUT: ₹2.48 lakh cr TDs repricing by May 2026 → 60–70 bps relief expected Q2 FY27
Is the Foundation Strong? Absolutely.
| Item (₹ Cr) | FY23 | FY24 | FY25 | Sep 2025 |
|---|---|---|---|---|
| Total Assets | 1,461,831 | 1,561,835 | 1,818,170 | 1,920,935 |
| Total Deposits | 1,290,347 | 1,379,225 | 1,577,020 | 1,629,131 |
| Total Advances | 840,792 | 921,344 | 1,030,874 | 1,100,000 |
| Borrowings | 70,149 | 72,586 | 105,807 | 109,162 |
| Net Worth | 100,678 | 108,185 | 130,839 | 142,247 |
Assets CAGR 9.5% (FY23–Sep25). Advances CAGR 14.2%. Deposits CAGR 6.2%. The balance sheet expansion is real and self-sustaining.
CRAR at 16.77%, well above 9% minimum. CET1 at 12.52%. The bank raised ₹5,000 crore via QIP in Q2 FY25. Tier 1 capital ratio of 14.13% is among peers’ best.
LCR at 141.67% (vs 100% requirement). Excess SLR investment ₹0.92 lakh crores. The bank is not scrounging for deposits. It’s choosing which ones to take.
Operating Cash: The Engine That Never Quits
| Cash Flow (₹ Cr) | FY23 | FY24 | FY25 |
|---|---|---|---|
| Operating CF | +22,592 | -27,939 | +22,075 |
| Investing CF | -732 | -1,506 | -1,578 |
| Financing CF | +1,275 | +3,518 | -1,138 |
| Net Cash Flow | +23,135 | -25,928 | +19,359 |
How Does PNB Stack Up? Surprisingly Well.
Annual Trends — FY23 to FY25 + TTM
| Metric (₹ Cr) | FY23 | FY24 | FY25 | TTM |
|---|---|---|---|---|
| Revenue | 86,845 | 109,065 | 124,010 | 130,497 |
| Operating Profit | 13,945 | 25,346 | 27,815 | 30,287 |
| OPM % | 16% | 23% | 22% | 23% |
| PAT | 3,359 | 9,157 | 18,553 | 19,387 |
| EPS (₹) | 3.04 | 8.27 | 16.08 | 15.47 |
This is not linear. FY23 was depression, FY24 was recovery, FY25 was proper turnaround. Now TTM shows stabilization at elevated levels. This is a business fundamentally healed.
PNB vs The Competition: Discount Unjustified?
| Bank | CMP (₹) | P/E | P/B | ROE % | GNPA % |
|---|---|---|---|---|---|
| PNB | 119 | 7.71x | 0.92x | 17.8% | 3.19% |
| SBI | 1,143 | 13.02x | 1.78x | 17.20% | 2.13% |
| Canara Bank | 146 | 6.56x | 1.13x | 17.75% | 3.27% |
| Union Bank | 189 | 7.60x | 1.10x | 17.05% | 3.51% |
| Bank of Baroda | 295 | 7.85x | 0.93x | 15.53% | 4.54% |
Median PSU P/E: 7.71x. Median PSU P/B: 1.0x. PNB is not cheaper on P/E, but it’s materially cheaper on P/B despite better ROE than half the peers. The GNPA cleanup also stands out — only SBI has better asset quality, and that costs 69% more per rupee of earnings.
Who Owns This Bank? Mostly: The Government.
Promoter: Government of India (70.08%)
Central Government through President of India. The bank is systemically important. Any material stress is effectively government concern. Capital support in the past: ₹55,000+ crore over 4 years post-amalgamation. No pledges. Clean slate.
Institutional Players (21.62%)
DIIs hold 16.09% (including LIC at 8.85%). FIIs hold 5.93%. Both groups have steadily increased stakes. LIC essentially made PNB an insurance-backed bank. Smart money is accumulating.
- Promoters70.08%
- DIIs (incl. LIC 8.85%)16.09%
- FIIs5.93%
- Public7.91%
- Total Shareholders23.09 Lakh
Shareholder base grew from 20.67 lakh (Mar 2023) to 23.09 lakh (Dec 2025). Retail India is joining the party. Nobody talks about it because PSU = “government bank” = boring. But boring is where money is made.
The Auditors Didn’t Flag Anything. That’s Good.
✅ Governance Scorecard
- ✓ Unqualified audit opinion — zero caveats
- ✓ BRSR (ESG disclosure) filed for FY25
- ✓ Regulatory ratings reaffirmed (CRISIL AA+, Fitch upgraded to ‘bb’)
- ✓ New MD&CEO appointed (Ashok Chandra, Jan 2025)
- ✓ Treasury gains properly disclosed (₹912 cr from Canara HSBC stake sale)
- ✓ Management transparency at concalls is excellent
⚠️ Watch List
- ⚠ Currency chest penalties (minor: ₹6.71 cr total in Dec ’25 & Jan ’26)
- ⚠ SAFEMA penalty: ₹15.37 crore (appellate tribunal, fully provided)
- ⚠ Borrowal fraud disclosures (₹2,434 cr; 100% provisioned, resolved under CIRP)
- ⚠ SMA book at 4.61% (combined SMA-0/1/2) — early warning bucket to monitor
- ⚠ New management in place — execution risk until proven track record
PSU Banks: The Discount Store That Actually Works
Indian banking sector is stuck in a paradox. Valuations are compressed because of legacy PSU fears. But today’s PSU banks are not yesterday’s dinosaurs. They lend to MSME/retail at better terms than NBFCs, operate with government backup that privates can’t match, and control 50%+ of system deposits. They’re boring for a reason: they work.
🏢 PSUs Own Half the System (And Half of Nothing)
Public sector banks control ~50% of total system deposits and advances. But their equity valuations sum to less than one HDFC Bank. Why? Because markets internalize “government bank = bad execution.” Now? PNB is literally executing better than half of private peers. The discount is misplaced.
📈 Credit Growth: PSUs Are Growing, Quietly
Retail/MSME advances at PNB grew ~18%+ in 9M FY26. Corporate growth is being moderated by management (they’re shedding low-yield corporate pools and upgrading mix). Total advances CAGR 14.2% over 2.5 years. This is not a “mature bank in decline” narrative. This is a bank choosing its growth.
💰 Margin Compression is Temporary, Not Structural
Yes, NIM fell from 3.09% (FY24) to 2.93% (FY25) to 2.65% (Q3 FY26). Reason: RBI cut repo rate 250 bps since 2023, and advances repriced faster than deposits. But ₹2.48 lakh crore of term deposits are repricing upward from April onwards. Management’s 60–70 bps margin expansion in Q2 FY27 is not aspiration; it’s math. Deposit repricing is inevitable.
⚡ Regulation: ECL Transition is a One-Time Headwind
April 2027 ECL transition will require banks to provision more upfront for future losses. PNB is pre-funding explicitly. This costs ~₹500 cr/quarter near-term. But once phased in (5 years), earnings normalize at a higher capital efficiency base. It’s like home renovation: painful during construction, valuable after.
Competitive dynamics: SBI is larger, commands premium valuations, and has better brand equity. Canara Bank and Union Bank are smaller but equally cheap. PNB’s edge: 70% government ownership, third-largest balance sheet, and management that actually learned to execute. The bar is low for PSUs. When one clears it, the repricing can be sharp.
Macro tailwinds: RBI is likely in easing mode (repo cuts are done; rates will stay); higher rates kill loan demand but boost spread recovery as deposit repricing filters in. Vehicle sales are strong (EV + traditional). Agricultural loans growing steadily. Rural banking reaching 40,000+ branches across PSUs. The macro is benign.
The Sleeping Giant Nobody’s Watching
Punjab National Bank is a bank that spent 5 years cleaning house and is now ready to party. ₹5,100 crore Q3 profit. 17.8% ROE. 3.19% GNPA (decade-low). 0.92x P/B. 70% government ownership. And yet, it trades as if it might fail next quarter. The market’s pessimism bias toward PSUs has created a vacuum of opportunity.
Recent Execution: Q3 FY26 saw profit grow 13.2% YoY despite NIM compression. Management is building provisions for ECL transition with explicit honesty. Asset quality improved across every metric. Operating margin expanded 200 bps YoY. The business is doing exactly what turnaround stories do in year 5: quietly consolidating gains.
The Repricing Catalyst: ₹2.48 lakh crore of term deposits repricing from April onwards. Management’s 60–70 bps margin expansion math is not aspirational; it’s deposit cycle mathematics. If executed, this lifts EPS by ~12–15% starting Q2 FY27. Add credit growth of 10–12%, and normalized profit growth is 15–18% annually. At 7.71x P/E, that’s a growth-adjusted discount.
The Government Guarantee: 70% ownership means systemic importance is built in. The government recapitalized this bank ₹55,000 crore over four years post-amalgamation. They’re not walking away now. That’s not a weakness; it’s a structural put option. For conservative investors, it changes the risk calculus entirely.
The Valuation Angle: At 0.92x P/B with 17.8% ROE, historical mean reversion alone suggests target ~1.1x P/B → ₹143/share (20% upside). Add the earnings re-rating from margin normalization + credit growth, and you’re looking at ₹160–186 over 18–24 months. Dividend yield at 2.43% provides ballast.
What Could Go Wrong?: New MD transition risk (though Ashok Chandra comes with solid background). Macro shock that derails deposit repricing (unlikely given monetary easing). Asset quality deterioration if credit cycle turns ugly (early warning: SMA at 4.61%, but this is better than pre-fix era). These are real but not probable given management’s current execution trajectory.
✓ Strengths
- 70% government ownership — systemic backstop
- 17.8% ROE — genuinely competitive among peers
- 3.19% GNPA — decade-low asset quality
- ₹22,075 cr operating cash flow
- Distribution network: 10,228 branches + 32,278 BCs
- Management transparency on ECL pre-funding
✗ Weaknesses
- NIM compression to 2.65% (though repricing visible)
- CASA ratio at 37.29% (lower than peers)
- Cost-to-income at 51.9% (room for efficiency gain)
- SMA book at 4.61% — early stress indicator
- New MD in place — execution continuity risk near-term
→ Opportunities
- ₹2.48 lakh cr deposit repricing (60–70 bps margin expansion)
- Retail/MSME growing 18%+ (sticky, high-margin)
- Digital lending: “every 3rd loan” in digital mode now
- Cost optimization: target 50% cost-to-income ratio
- Credit growth 10–12% annually (system growth is 8–9%)
⚡ Threats
- Macro downturn killing loan demand
- Deposit repricing delays or execution slip
- Credit cycle deterioration (SMA bucket fills up)
- New regulations requiring additional capital (BCBS etc.)
- Government dividend pressure (fiscal constraints)
Punjab National Bank is a PSU bank that learned to execute. That alone makes it worth attention.
History: Founded 1895. Absorbed two banks in 2020. Spent 5 years fixing the plumbing. Now: Printing cash, improving asset quality, and preparing for regulatory transitions with explicit transparency. The market hasn’t noticed because “PSU” rhymes with “suspect.” The market is wrong.
Valuation at 0.92x P/B provides margin of safety. Deposit repricing catalyzes near-term earnings growth. Government ownership derisk tail scenarios. Management execution is genuinely improving. For investors seeking PSU exposure with actual upside, PNB is the answer to a question the market doesn’t think it’s asking.