Search for Stocks /

Rubicon Research Q4 FY26: The Outsourcing Trap and a 86x P/E Waiting for Pithampur

Spotted a factual error — a wrong number, date, or fact? Tell us and we will check the source.

General information and entertainment, not investment advice. The author is not a SEBI-registered adviser or research analyst. No recommendation, no promised returns. Markets carry risk including loss of capital. Figures may not be current. Consult a registered adviser before acting.


1. At a Glance

Revenue hit ₹514 Cr in Q4, up 44% year-on-year. Profit jumped 112%, but net profit landed at ₹77 Cr—a thin 15% of sales. The stock sits at P/E 86.4x, a three-tier lift from its own 5-year average of 60.8x. Margins held at 23%, yet gross profit was pressured by outsourced manufacturing (more on that torture below). Cash piled up to ₹346 Cr, half the company’s market cap. The Pithampur facility is still waiting for its FDA inspection date; management says Q1 CY27 ramps are “on track”—which in pharma-speak means “pending inspection.”

Working capital bloated to 104 days from 92 last year, a warning sign wrapped in inventory labeled “fuel for growth.”


2. Introduction

Rubicon Research went public in October 2025 at ₹ 733 per share and listed at ₹ 773. Nine months later, the stock trades 68% higher. The IPO raised ₹1,378 Cr; management deployed it into three buckets: debt repayment, the ₹ 176 Cr Arinna Lifesciences acquisition (April 2026, 85% stake), and Pithampur capex.

For context, the company has been around since 1999, operating three USFDA-approved plants across India and serving the US generic market (99.5% of revenue). It has 66 commercialized products and 81 FDA approvals, focused on oral solids, liquids, and nasal sprays. In January 2026, AdvaGen Pharma (Rubicon’s US arm) received a ₹ 419 Cr tax demand for FY 2021-22; management flagged an appeal is planned.


3. Business Model: WTF Do They Even Do?

Rubicon manufactures generic formulations in India and sells them into the US market through its own distribution subsidiary, AdvaGen Pharma, and wholesalers. The portfolio spans CNS drugs (27% of Q1 FY26 revenue), analgesics (24%), and cardiovascular (19%)—no single product carried more than 14% of sales.

The business model is a classic Indian pharma arbitrage: develop drugs in-house (R&D spend ₹194 Cr in FY26, 11% of sales), manufacture at scale across three plants, and funnel into a highly regulated, high-margin US market where supply is tight and switching is expensive.

Specialty drugs (fewer competitors at launch) contributed ₹ 200+ Cr gross margin in FY26—about 21% of the gross profit—a magnet for pharma investors hunting for pricing power. The company filed 24 products “under review” with the FDA as of the latest concall and approved 12 in FY26, so the pipeline velocity is real. Top 5 products sit at 39% of Q4 sales; top 10 at 57%, which management celebrated as “no concentration risk” (a tone-deaf framing: half your revenue riding on ten products is not resilience).

Dosage form split: oral solids 85.5%, liquids 10%, nasal 2%. All three categories see price stability “due to portfolio mix,” though this line will age poorly if tariff whims shift.


4. Financials Overview

Figures are consolidated, in ₹ crore.

MetricQ4 FY26YoYQoQ
Revenue514+44%+8%
EBITDA (incl. other income)121+67%+3%
PAT77+112%+7%
EPS4.66

FY26 annual: Revenue ₹1,754 Cr (+37% YoY), PAT ₹247 Cr (+84% YoY), EPS ₹14.98.

Concall context (Jun 2026): Management credited Q4 strength to broad-based demand (“not driven by a single product or two”) and reaffirmed EBITDA margin guidance at 22–23%, which they reiterated includes ESOP costs, Arinna integration costs, Pithampur pre-ramp costs, raw material and logistics inflation. The margin hold is the story: revenue is +67% EBITDA YoY, but gross margin compressed due to outsourced manufacturing. Management acknowledged they ramped outsourced volume to “avoid losing customers and product sales”—a euphemism for capacity crunch. They expect “at least a couple more quarters” of outsourcing reliance before internalization kicks back in.


5. Market Expectations & Historical Multiples

This section describes how the market is currently pricing the company and how that compares with its own history and peer group. It is descriptive, not predictive.

MetricCurrent5-Yr AveragePeer Median
P/E86.460.831.99
EV/EBITDA52.2
ROE27.0%16.5%12.46%
ROCE28.4%15.14%

The market currently pays 86.4x earnings here versus a peer median of 31.99x. The gap reflects investor pricing for a near-term ramp and the specialty drug portfolio upside, though it sits above the company’s own 5-year historical range.

Return on equity stands at 27%, a 1,600bp improvement from the 5-year 16.5% average. ROCE is 28.4%, a credible capital-allocation track record. However, the margin of error shrinks: Pithampur requires FDA inspection clearance, Arinna must integrate profitably by FY28, and gross margin pressure is real near-term. The market appears to be pricing in a successful Pithampur ramp (raising EBITDA by ₹ 100+ Cr annually once full) and sustained specialty-drug margin bleed-through.


6. What’s Cooking

Pithampur facility: Acquired June 2025 for ₹ 149 Cr from Alkem. FDA site qualification complete. Products filed. FDA inspection pending. Management targets Q1 CY27 ramp-up; capacity utilization expected to reach “decent levels” within 12–18 months post-inspection. This is a sterile/complex facility (hormones, steroids, immunosuppressants, oncology)—higher barrier to entry, higher gross margin. Capex guidance: ₹ 300 Cr over the next couple of years across all sites.
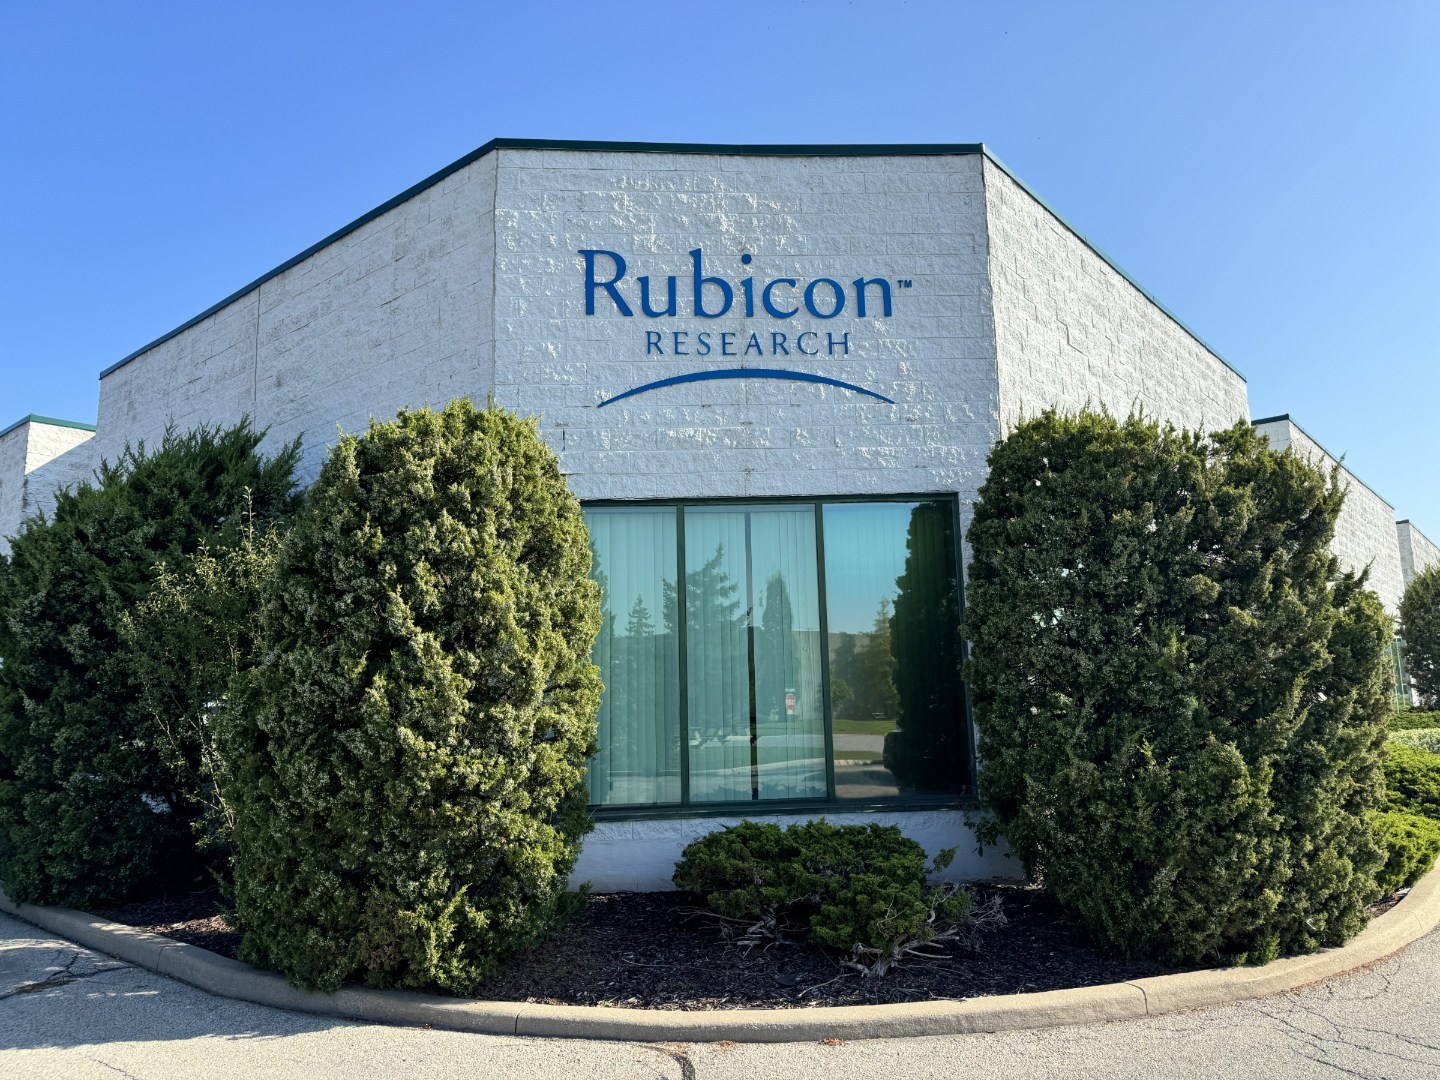
Arinna Lifesciences acquisition: ₹ 176 Cr invested (85% stake) for a CNS-focused Indian pharma platform with ₹ 600 Cr standalone revenue. Founder Vivek Seth stays as MD. The deal adds 4,000+ prescribers and an existing distribution network. Management framed this as not a geography shift but a “therapeutics platform play” to monetize Rubicon’s specialty pipeline in India. Next few quarters are “laying the foundation of growth”; profitability improvement targeted post-FY27. EBITDA guidance already factors in integration costs.

R&D pipeline: 24 products under FDA review. 12 approvals in FY26. R&D spend ₹ 194 Cr (11% of sales) against a forward target of ₹ 500 Cr over 9 quarters (FY26 + FY27 + Q1 FY28). Management positioned 5x+ productivity as achievable going forward.

Tax demand: AdvaGen Pharma received a ₹ 419 Cr income tax demand (AY 2021-22) on 5 January 2026. An appeal is planned. This is a single-year demand; scale relative to FY26 PAT of ₹ 247 Cr.

Board dividend: 150% dividend recommended (₹ 1.5 per share), described as a 10% payout ratio on FY26 PAT.


7. Balance Sheet

ItemMar 2024Mar 2025Mar 2026
Total Assets1,1091,4512,327
Net Worth (Equity + Reserves)3855411,289
Borrowings425418311
Other Liabilities300493727

Assets = Liabilities per column; balance sheet balances.

The balance sheet morphed post-IPO. Equity swelled ₹ 1,289 Cr (up from ₹ 541 Cr) due to IPO proceeds. Borrowings fell to ₹ 311 Cr, a 27% year-on-year decline. Debt-to-equity improved to 0.24x. Other liabilities expanded to ₹ 727 Cr, a 47% jump driven by receivables factoring (management said they factored one-third of AR) and Arinna acquisition debt funding.

Three sarcastic bullets:

  • The “cash pile” ₹ 346 Cr is not a fortress; it’s half the market cap. If Pithampur stumbles or Arinna underperforms, burn accelerates and the narrative reverses.
  • Working capital at ₹ 6,163 Cr (126 days) sits in inventory, not cash. Management called it “fuel for growth,” which is true but also euphemism for “we have money tied up and hope demand keeps accelerating.”
  • Receivables are ₹ 509 Cr (106 debtor days), factored one-third to ease cash. Factoring is a tax on cash flow; it signals the company was willing to give up a percentage to avoid the wait.

Wisdom line: A balance sheet with nothing to hide, a valuation with everything to prove.

Net cash position: ₹ 346 Cr cash minus ₹ 311 Cr borrowings = ₹ 35 Cr net cash, or ₹ 2.1 per share.


8. Cash Flow: Sab Number Game Hai

PeriodOperatingInvestingFinancing
FY2421-6844
FY25159-65-40
FY26205-410283

Operating cash flow improved: ₹ 205 Cr in FY26 vs. ₹ 159 Cr in FY25. Investing activity turned negative ₹ 410 Cr (up from ₹ 65 Cr), driven by Pithampur capex, fixed deposits from IPO proceeds, and Arinna capex. Financing brought in ₹ 283 Cr (mostly IPO proceeds and debt for Arinna).

The story: cash generation is healthy, but capex (especially Pithampur + Arinna) is eating it whole. Free cash flow (CFO minus capex) remains underwater near-term; Pithampur ramp must deliver ₹ 100+ Cr annual EBITDA to reverse it.

Wisdom line: The machine prints cash, but management is feeding it back into the furnace faster than the furnace can burn it.


9. Ratios: Sexy or Stressy?

RatioMar 2026Interpretation
ROE27.0%Equity is working overtime; 27 paise of profit per rupee of shareholder capital.
ROCE28.4%Capital is being deployed at returns above cost; a healthy signal for long-term value creation.
P/E86.4The market is pricing for a multi-year growth festival, not just near-term earnings.
PAT Margin14.1%Bottom-line is 14 paise per rupee of sales; stable, not flabby.
D/E0.24Debt is a quarter of equity; balance sheet is light.

Each ratio reflects operational strength, not investment thesis. The company’s equity is being deployed at a 27% return on shareholders’ capital—a credible figure for a capital-light generics play with pricing power in specialty products. ROCE mirrors ROE because the company is majority-equity-financed, so the two track closely. The D/E ratio is conservative, leaving room for inorganic moves (Pithampur, Arinna) without balance sheet strain.

The wrinkle: ROE is 27%, but EPS is growing at 85% (3-year CAGR). That arithmetic only works if equity base is shrinking (buybacks) or profit is growing faster than equity (retained earnings + IPO proceeds deployed at high-return projects). Here, it’s the latter: Pithampur and Arinna are meant to scale profits faster than equity.


10. P&L Breakdown: Show Me the Money

YearRevenueEBITDAPAT
FY2485415591
FY251,284256134
FY261,754400247

Revenue grew 37% in FY26; EBITDA grew 56% (note: faster than sales, a margin expansion story); PAT grew 84% (faster again, a tax and depreciation benefit story). The trend is clean upside trajectory.

Operating margin (EBITDA ÷ Revenue) improved from 20% in FY25 to 23% in FY26, driven by the portfolio shift toward specialty (higher margins) and raw material tailwinds during FY26. PAT margin improved from 10.4% to 14.1%, a 370bp expansion, thanks to lower depreciation per rupee of sales (the base is larger now) and tax rate improvement from 31% to 23%.

The business is accelerating: each rupee of new revenue is pulling down more EBITDA and PAT than the prior year. But the near-term headwind is real: outsourcing is pressuring gross margin, and Pithampur/Arinna integration will cost ₹ 50+ Cr annually until ramp. The market is betting FY27-28 earnings surprise to the upside.


11. Peer Comparison

CompanyRevenuePATP/E
Sun Pharma58,46212,47734.8
Divi’s Lab10,5602,62367.4
Torrent Pharma13,9802,19270.6
Cipla28,1633,80629.5
Zydus Lifesci27,1485,42620.5
Dr Reddy’s33,7004,19625.3
Lupin27,9585,76518.1
Rubicon Research1,75424786.4
Peer Median (158 cos)62241.532.0

Rubicon is the smallest by revenue (about 3% of Sun’s scale) but trades at 86.4x earnings versus a peer median of 32x. The gap reflects a scale discount in reverse: smaller companies command a growth premium. Divi’s Lab and Torrent Pharma trade at 67–71x, but both are larger (₹ 10–14k Cr revenue) with established dominance in specific therapeutic franchises. Lupin trades at 18x despite ₹ 28k Cr revenue and solid ROCE (30%), signaling investor skepticism on growth.

Rubicon’s multiple compresses to peer median only if FY27-28 profit growth stalls or Pithampur/Arinna disappoint. It reprices higher if both ramp on schedule and specialty margin footprint expands.


12. Miscellaneous: Shareholding & Promoters

HolderMar 2026
Promoters59.9%
General Atlantic (PE investor)35.9%
Surabhi Parag Sancheti7.9%
Sumant Pilgaonkar7.9%
Pratibha Pilgaonkar3.9%
Sudhir D Pilgaonkar3.9%
FIIs7.5%
DIIs10.0%
Public22.6%

General Atlantic Singapore RR Pte. Ltd. holds 35.9% and is the largest single promoter (acquired 58% in April 2019, later sold some to the Pilgaonkar/Sancheti families). Three Sancheti-Pilgaonkar family members own another 19.7% of promoters’ stake. Pratibha Pilgaonkar, a co-founder, has four decades in pharma. The leadership is experienced, and General Atlantic’s presence adds institutional rigor.

Promoter roast: No pledges (Pledged percentage: 0.00%) is a good sign. The family owns the company they run, which aligns incentives but also concentrates risk. General Atlantic’s playbook is typically a 7–10 year exit (IPO route completed; likely thinking of secondary sale or dividend recapture). No red flags on governance or promoter conduct in the announcements.


13. Corporate Governance: Angels or Devils?

Auditors: Deloitte India.

Board: Eight directors. No audit committee delays or related-party transaction hiccups flagged in recent filings. Annual secretarial compliance (May 2026) confirmed full SEBI and LODR compliance with no non-compliances noted.

Pledges: Zero.

Related-party transactions: Standard (inter-company charges for R&D and manufacturing). Nothing unusual.

Resignations: Anand Agarwal resigned Feb 2026 (no specifics given). Dr. Pradnya appointed Feb 2026. Minor churn, not alarming.

Tax demand: AdvaGen Pharma, the US subsidiary, received ₹ 419 Cr income tax demand (AY 2021-22, Jan 2026). Appeal is planned. This is a known item, disclosed, and management is contesting. Not a hidden scandal.

Fact-flagging: The tax demand is real but not catastrophic (about 1.7x FY26 PAT). If the appeal is lost, it comes out of retained earnings post-IPO. No covenant breach risk.


14. Industry Roast & Macro Context

US generics are a brutal commodity market: pricing erodes 8–12% annually due to biosimilar launches, supply overhang, and customer consolidation. Wholesalers (Cardinal, McKesson, Amerisource) control >90% of US drug distribution and are always hunting for cost. A single product losing exclusivity can cut revenue by 30–50% in a year.

Rubicon’s hedge: specialty generics (narrow patient populations, fewer competitors, higher margins, slower pricing decay). The company has 16 specialty products generating ₹ 200+ Cr gross margin, a 2–3 year window before the next wave of generics eats margin.

Regulatory risk is endemic: any FDA enforcement action (import alert, GMP warning letter) can lock a facility out for months. Rubicon has three plants and hasn’t faced major FDA enforcement, a credit to operations. But the risk doesn’t go away.

Tariff winds are shifting: the US has imposed a 26% reciprocal tariff on Indian imports (pharmaceuticals are currently exempt, but that’s subject to future action). Rubicon manufactures 99% of its volume in India and exports it, so a tariff blow would compress gross margin by 200+ bp overnight.

Sector view: US generics are maturing, but specialty and differentiated formulations (nasal, complex CNS, potent compounds) are growing 15–20% annually. Rubicon is positioning into that stream, but competition from larger peers (Cipla, Dr. Reddy’s, Lupin) doing the same is heating up. The edge is temporary.


15. EduInvesting Verdict

PositivesNegatives
StrengthsSpecialty portfolio generating 21% of gross profit; R&D productivity improving (5.9x over 3 years); management experienced and incentive-aligned; net debt minimal post-IPO; ROCE/ROE both >25%.Gross margin under pressure from outsourcing; top 5 products = 39% of revenue (concentration risk despite denial); working capital days bloated to 104 (up from 92); P/E 86x leaves no margin of error.
OpportunitiesPithampur ramp could add ₹ 100+ Cr EBITDA by FY28; Arinna CNS platform unlocks India market for specialty drugs; 24 products under FDA review signal 3–5 year pipeline strength; FDA approvals at 12/year show execution.Tariff escalation could compress gross margin 200+ bp; tax demand could recur; Pithampur inspection timing uncertain; Arinna profitability improvement unproven; macro generics pricing decay persists.

The central tension: A company with genuine competitive moats (specialty drug portfolio, R&D velocity, scale-adjusted capex discipline) is being valued as if all three moats will widen simultaneously over three years. Pithampur must ramp on time, Arinna must hit FY28 profitability targets, and specialty margins must hold despite larger peers also fishing in that pond. The balance sheet can absorb one missed quarter; two missed quarters and the story breaks.

The numbers work if execution holds. The stock is pricing for execution. The gap between the two is the only conversation worth having.
