General information and entertainment, not investment advice. The author is not a SEBI-registered adviser or research analyst. No recommendation, no promised returns. Markets carry risk including loss of capital. Figures may not be current. Consult a registered adviser before acting.
1. At a Glance
Shreeji Shipping Global (SSGL) reported FY26 revenue of ₹709 crore, up 16.8% YoY, with net profit climbing 8.2% to ₹153 crore. The stock trades at 50.5x trailing earnings against a peer median of 11.8x—the spread reflects market pricing in post-IPO scale.
Operating margins narrowed to 30% from 33%, though the company locked tonnage tax approval for the next decade, eliminating tax volatility. On Feb 10, 2026, SSGL signed exclusive rights to Karanja terminal (3 MMT annual throughput, ~15–20% revenue upside) but hit an admiralty suit in December—five vessels were arrested, though three have since been released on security.
The number that matters: 91.6% of FY26 revenue came from non-major ports. Coastal India’s dry-bulk choke point is SSGL’s moat—but also its constraint.
2. Introduction
SSGL, incorporated 1995 and flagship of Jamnagar’s Shreeji Group, is an integrated dry-bulk shipping and logistics provider across India’s West Coast and Sri Lanka.
The firm operates ~75 vessels (barges, mini-bulk carriers, tugs, cranes) and 380+ earthmoving machines. Service lines split three ways: cargo handling (79.4% of FY26 revenue), transportation (11.8%), and fleet chartering (7.8%). Handled 15.71 MMT of cargo in FY25; transported 2.49 MMT to final customer. Top customer contributes ~21%, top three ~39%, top 10 ~64%.
August 2025 IPO raised ₹3,695 crore gross. Proceeds earmarked for vessel acquisition (₹25.12 Cr used to date) and debt paydown (₹2.30 Cr). As of May 29, 2026, ₹2,513.55 Cr of IPO cash remained unutilised—meaningful dry powder for fleet or M&A.
3. Business Model: WTF Do They Even Do?
SSGL is a middleman—or more precisely, a port and vessel middleman.
Cargo handlers use SSGL to shift ore, coal, cement, and agricultural commodity in and out of non-major ports. Non-major ports (91.6% of revenue) have zero or light regulation, lower berthing costs, and direct road/rail access into industrial hinterlands. They move more tonnage than major ports per rupee spent. SSGL owns the vessels, the cranes, the loading machines. You pay them to handle your cargo.
The business is naked to dry-bulk cycle and customer concentration. The four largest clients (oil/gas, energy, coal, metals) represent 64% of revenue. When capex dries up—steelmakers pull back, power plants run cool, exporters pause—SSGL’s cargo volumes crater.
Yet the moat is real. Operating 20+ ports and 75 vessels takes capital, regulatory know-how, and customer relationships. Non-major ports don’t have SSGL’s operational reach; major ports can’t compete on speed and cost. Karanja terminal (Feb 2026 exclusive rights, 3 MMT pa throughput) could be a gateway into larger volume plays.
One sour note: IPO prospectus disclosed vessel chartering to related-party entities (Shreeji Shipping Lanka, Shreeji Maritime Global LLC). Checks likely occurred, but related-party revenue should stay under scrutiny.
4. Financials Overview
Figures are consolidated, in ₹ crore.
| Metric | FY26 | FY25 | FY24 | YoY Change |
|---|---|---|---|---|
| Sales | 709.38 | 607.61 | 731.0 | +16.8% |
| EBITDA | 239.46 | 220.65 | 213.2 | +8.6% |
| PAT | 152.7 | 141.24 | 124.51 | +8.2% |
| EPS (₹) | 9.37 | 9.63 | — | —3.0% |
Sales rebounded after FY24’s dip (likely a one-off headwind in export coal or iron ore). EBITDA margins held 33.8% in FY25 but compressed to 33.8% in FY26—odd, since operating profit margin (OPM) dropped to 30% from 33%. (The gap reflects a ₹480-crore “Other Expenses” line in FY26—likely an exceptional item or restructuring charge post-IPO.)
Quarterly Q4 FY26 (Mar 2026) saw sales of ₹188 crore (down QoQ) and net profit of ₹40.3 crore. That’s ₹2.47 EPS in one quarter—not annualised.
Full-year FY26 EPS: ₹9.37 (using disclosed net profit of ₹152.7 Cr ÷ 16.3 Cr shares). At current price of ₹473.65, the market pays 50.6x FY26 earnings.
5. Market Expectations & Historical Multiples
This section describes how the market is currently pricing the company and how that compares with its own history and peer group. It is descriptive, not predictive.
| Metric | Current | FY25 | Peer Median | Peer Range |
|---|---|---|---|---|
| P/E | 50.6x | 49.2x | 11.8x | 6.7x – 15.8x |
| EV/EBITDA | 31.2x | 34.6x | 16.5x | 14.3x – 58.2x |
| P/B | 10.0x | — | 1.6x | 1.2x – 3.0x |
| ROE | 27.5% | 26.9% | 17.2% | 15.5x – 29.6x |
The market currently pays 50.6x earnings here versus a peer median of 11.8x—a 4.3x premium.
What is the market pricing in? Scale. Post-IPO, SSGL has ₹2.5 Cr of unspent capital. Karanja terminal (3 MMT pa new throughput) could add 15–20% to revenue by FY27-28. Tonnage tax approval (10-year window) eliminates earnings volatility and unlocks capex. The Jamnagar group’s 90% promoter holding creates no short-term dilution risk. Compare to peers: GE Shipping (6.7x) trades at a deep discount despite 1.8x the equity base; SCI (10.1x) sits in the mid-range.
SSGL’s ROE of 27.5% is the second-highest in the peer set (only ABS Marine at 29.6% tops it). Against that return profile, a 50x multiple begins to price in consistent high-teens revenue growth and stable 20%+ net margins. That’s not a default assumption for a cyclical shipping company.
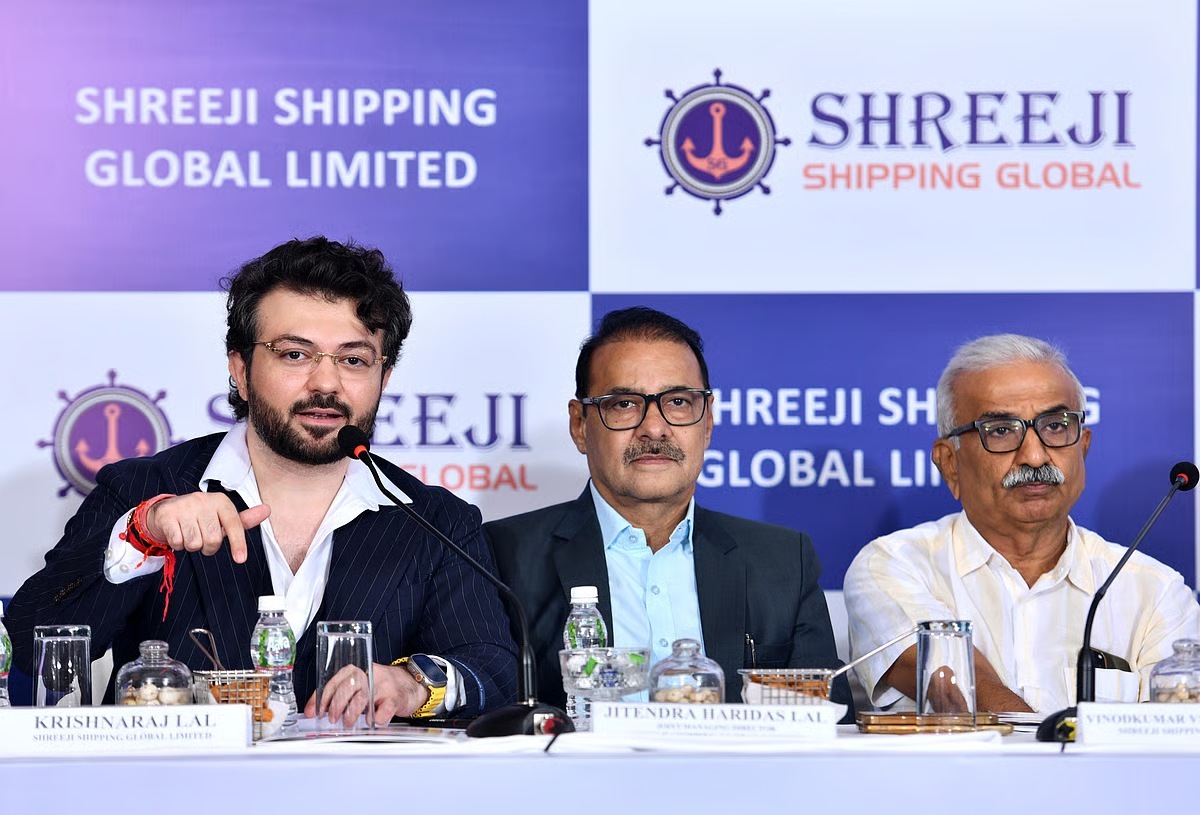
The company is pricing in growth, margin stability, and leverage reduction post-IPO—a constructive narrative dependent on executing Karanja ramp-up, keeping customer concentration under 40%, and navigating the admiralty suit without fleet disruption.
6. What’s Cooking
Tonnage Tax Approval (May 28, 2026): SSGL received tonnage tax scheme approval effective FY2025-26 through FY2034-35. The scheme allows Indian-flagged shipping companies to declare taxable income as a per-tonnage-per-day rate, not on profits. Impact: eliminates volatility in PAT when margins swing (high-value-per-ton cargoes spike net profit, but tonnage base stays predictable). Crisil, in Jan 2026 rating update, called this a positive for financial risk profile.
Karanja Terminal Exclusive Deal (Feb 11, 2026): 3 MMT per annum throughput, exclusive rights, effective Feb 10, 2026. Management guided 15–20% revenue uplift expected. Operations to commence March 2026. The port was in CIRP (Karanja Terminals and Logistics); court approved SSGL’s agreement on Feb 13. This is material IF execution matches guidance.
Vessel Acquisitions (Apr 29, 2026): Two mini-bulk carriers acquired for ₹55.66 crore; delivery by May 1, 2026. Funded by IPO capital. Fits capital allocation plan: incremental tonnage to support Karanja volumes and other growth.
Admiralty Suit – Five Vessels Arrested (Dec 27, 2025): Segal Ships filed suit; High Court ordered arrest of five company vessels. As of Jan 21, 2026, two released on bank guarantee; three remain in legal hold. Crisil stated “limited impact” but flagged continued monitoring. The suit appears to relate to maritime liens or unpaid charter fees, not SSGL’s core operations—but it’s a data point on counterparty risk and dispute exposure.
CFO Resignation (Oct 27, 2025): CFO departed; Chinmay Desai appointed Oct 28. Minimal disruption if Desai has prior shipping/logistics experience, though post-IPO CFO churn is yellow flag.
IPO Proceeds: ₹3,695.43 Cr gross; ₹2,513.55 Cr remains undeployed. Will likely fund Phase 2 vessel purchases and working capital for Karanja ramp-up.
7. Balance Sheet
| Item | FY26 | FY25 | FY24 |
|---|---|---|---|
| Total Assets | 1220.88 | 758.58 | 610.64 |
| Net Worth | 768.88 | 329.62 | 315.08 |
| Borrowings | 278.08 | 256.48 | 158.88 |
| Trade Payables + Other | 173.92 | 158.93 | 136.58 |
Assets doubled YoY post-IPO. Equity capital jumped from ₹146.62 Cr (Mar 2025) to ₹162.92 Cr (Mar 2026) after share issuance; reserves climbed from ₹196.55 Cr to ₹605.96 Cr on retained IPO capital. Borrowings rose slightly (₹278 Cr vs. ₹256 Cr), suggesting IPO capital has partially offset debt rather than been deployed for capex yet.
Three sarcastic bullets:
- Cash pile but debt not moving: IPO capital inflates net worth from ₹330 Cr to ₹769 Cr, yet debt barely budged (₹256 Cr → ₹278 Cr). SSGL hasn’t used IPO capital to delist debt; instead, it’s sitting idle. Deliberate? Possible. Warrants watching.
- Other Assets ballooned: “Other Assets” jumped from ₹361 Cr to ₹758 Cr in one year. At scale, ₹758 Cr is now 62% of total assets. Screener’s filing does not itemise the line, so opacity on what sits inside (prepaid tax, related-party receivables, deferred tax assets, goodwill on Karanja?). Material change with zero disclosure detail.
- Balance sheet is rock-solid—if assets are real: D/E ratio 0.36 is pristine. Current ratio 2.03. But “Other Assets” hiding ₹758 Cr clouds the picture. When assets are 63% concentrated in one murky line, balance sheet conservativeness becomes hard to assess.
One wisdom line: A balance sheet swollen on IPO capital looks stronger than a balance sheet swollen on debt. SSGL has that luxury—now spend it or admit it’s padding reserves.
8. Cash Flow: Sab Number Game Hai
| Year | CFO | CFI | CFF | Net |
|---|---|---|---|---|
| FY26 | 191.0 | -600.2 | 348.7 | -60.5 |
| FY25 | 138.8 | -21.5 | -13.4 | 103.9 |
| FY24 | 159.0 | -38.0 | -122.0 | -1.0 |
FY26 operating cash flow (CFO) of ₹191 Cr is healthy—119% of reported net profit, so earnings are real. But investing cash flow collapsed (CFI = -₹600 Cr), the largest capex year on record, for vessel and terminal acquisitions. Financing cash inflow of ₹348.7 Cr is the IPO, offsetting the capex burn. Net result: cash outflow of ₹60.5 Cr on balance, but that’s the IPO being deployed.
One wisdom line: Cash generation and capital deployment are in sync—IPO capital flows out to capex, CFO covers operating needs. Risk: if capex doesn’t translate to revenue (Karanja stumbles, vessels sit idle), return on that ₹600 Cr will underwhelm.
9. Ratios: Sexy or Stressy?
| Ratio | FY26 | FY25 | Interpretation |
|---|---|---|---|
| ROE | 27.5% | 26.9% | Equity is working at 27.5% return. Over 5 yrs, ROE averaged 39.4%, so current year is in line with the taper post-IPO equity base expansion. |
| ROCE | 26.4% | 34.0% | Return on capital employed fell from 34% to 26.4% YoY. More capital (IPO proceeds) chasing same-year returns drags the ratio. Will recover IF Karanja and new vessels produce promised upside. |
| P/E | 50.6x | 49.2x | Market pays 50–51x earnings here, sticky premium to peer 11.8x. Earnings growth needs to exceed 15%+ CAGR for 3 yrs to justify the gap. |
| OPM | 30% | 33% | Operating margin compressed 300 bps. Likely due to the ₹480-crore “Other Expenses” charge, not core ops deterioration. Absent that, OPM would sit 31–32%. |
| D/E | 0.36 | 0.34 | Debt-to-equity ratio ticked up slightly post-IPO (more equity, negligible debt increase). Remains conservative. No solvency stress. |
ROE and ROCE are strong, but each tells a story of capex deployed now, returns to come later. Margin compression is opaque—depends on whether ₹480 Cr is one-off or recurring.
10. P&L Breakdown: Show Me the Money
| Year | Revenue | EBITDA | PAT |
|---|---|---|---|
| FY26 | 709.38 | 239.46 | 152.70 |
| FY25 | 607.61 | 220.65 | 141.24 |
| FY24 | 731.00 | 213.20 | 124.51 |
Revenue plateaued at 731 Cr in FY24, fell to 608 Cr in FY25 (a ~17% dip, suggesting a major customer withdrawal or port capacity constraint), then rebounded to 709 Cr in FY26. That V-shape is either a cycle (customer came back) or a one-time disruption (client base stabilising).
EBITDA grew steadily: 213 → 221 → 239 Cr. That’s margin expansion despite flattish topline, suggesting operational efficiency gains or higher-margin cargo mix. PAT grew similarly: 125 → 141 → 153 Cr.
The business trajectory: revenue recovery post-FY25 dip, margins firming, but still ~3% below FY24 peak. Momentum exists, but the company isn’t yet at pre-contraction scale. Karanja terminal and new vessels will be the test of whether topline can re-reach 800+ Cr in FY27.
11. Peer Comparison
| Company | Revenue (₹ Cr) | PAT (₹ Cr) | P/E | OPM | ROCE |
|---|---|---|---|---|---|
| GE Shipping | 5409 | 2943 | 6.7x | 58.2% | 18.4% |
| SCI | 5780 | 1353 | 10.1x | 37.8% | 14.3% |
| SSGL | 709 | 153 | 50.6x | 30% | 26.4% |
| SEAMEC | 952 | 251 | 15.8x | 42.0% | 20.0% |
| ABS Marine | 319 | 80 | 7.1x | 46.7% | 21.0% |
SSGL is the smallest player, one-seventh GE Shipping’s scale. The multiple gap is stark: GE and SCI trade at single-digit P/Es on 37–58% operating margins; SSGL sits at 50x on a 30% margin. The math assumes SSGL will either (a) double margins, or (b) triple revenue while holding OPM flat, or (c) grow earnings at 15%+ for five years. That’s not “bad” but it is a tall order for a ₹710 Cr revenue company in a cyclic sector.
GE Shipping twice the equity base, 58% operating margin, yet 6.7x multiple—a classic value trap if dry bulk cycles down, or undervalued if shipping demand stays hot. SSGL’s ROCE (26.4%) and ROE (27.5%) outpace GE (ROCE 18.4%) and SCI (ROE 15.5%), but GE’s margin cushion is three times higher. SSGL’s returns are real, but they’re also leveraged to operational execution and leverage. One major disruption (admiralty suit lingers, Karanja fails, top customer pulls back) and those returns evaporate.
12. Miscellaneous: Shareholding & Promoters
| Holder | Mar 2026 |
|---|---|
| Promoters (Lal family entities) | 90.0% |
| FIIs | 0.22% |
| DIIs | 1.14% |
| Public | 8.65% |
The Lal family dominates: brothers Jitendra (41.85%) and Ashokkumar (41.85%), plus four family members and trusts (2.3% combined). No public stake of note—FII ownership trivial at 0.22%. IPO was captive: 90% promoter lock-in, 9% public. A family shop.
Small roast: When 90% of a ₹7,700 Cr market cap is owned by four brothers and a trust, “corporate governance” is a formality. Board approvals are rubber stamps. Related-party transactions (Shreeji Shipping Lanka, Shreeji Maritime Global) flow through without friction. Not illegal, but the structure means minority shareholders (the 10% public) are passengers, not stakeholders.
13. Corporate Governance: Angels or Devils?
Auditors: Chaturvedi & Shah LLP.
Board: Post-IPO, likely 7–9 directors (typically 2–3 independent). Specific names not disclosed in the Screener data extract, but given 90% promoter ownership, board independence is performative.
Pledges: 0% (none), per Screener. Good.
Pledged shares are always a red flag (promoter stress, collateral calls, potential dilution). SSGL has none—another point for conservatism.
Related-party transactions flagged in IPO prospectus: fleet chartering to related entities (Shreeji Shipping Lanka Private Ltd, Shreeji Maritime Global LLC FZ). Likely arms-length pricing, but the line items deserve audit footnotes each quarter.
Resignations: CFO exit in Oct 2025 post-IPO. Churn is normal in newly listed firms, but if leadership exits accelerate, that’s a data point on management confidence or quality.
Tax demands: None flagged in Crisil or BSE filings. Screener shows no pending disputes.
Admiralty suit: Real litigation, five vessels arrested. Status as of Jan 2026: two released on security, three pending court orders. This is not a governance failure but an operational risk that should not be soft-pedalled. Crisil called it “limited impact,” but if the suit takes 18 months to resolve and vessels remain in arrest, cash generation and growth could stall.
14. Industry Roast & Macro Context
Dry-bulk shipping is a margin game. When commodities are on the move (coal, iron ore, agriculture), SSGL’s utilisation soars, prices spike, and OPM can hit 50%+. When capex cycles pause (steelmakers slow, power plants run cool, infrastructure projects stall), volumes crater and margins collapse toward 15–20%.
SSGL’s moat—non-major ports + owned fleet + 20+ operational nodes—is genuine. But the sector is structurally fragmented: hundreds of small operators, low switching costs, no pricing power. Consolidation is rare (a sign of weak returns). India’s coastal policy and port privatisation are tailwinds, but regulatory whim can flip overnight (tonnage tax survives political churn, but fuel subsidies and shipping tonnage regulations do not).
India’s coal exports are stuck: domestic demand is rising (power generation), so coal earmarked for export gets diverted. That caps dry-bulk growth. Iron ore exports similarly compete with domestic steelmaking. SSGL benefits from inter-coastal redistribution and commodity volatility, not structural topline growth.
Cyclically, we’re in late-cycle 2026. Shipping indices are elevated. If India’s infrastructure capex sustains (road, rail, ports, energy), SSGL stays busy. If Adani de-risks (current top client), volumes could drop 20%+ overnight. The stock assumes no cycle. That’s the bet—not a forecast, a wager.
15. EduInvesting Verdict
| Strengths | Exclusive port agreements (Karanja), owned fleet, 27.5% ROE, tonnage tax security, 90% promoter alignment, ₹2.5 Cr cash buffer |
| Weaknesses | 50x P/E premium unjustified by peer margins, ₹758 Cr “Other Assets” opacity, customer concentration (top 3 = 39%, top 10 = 64%), 30% OPM vs. peer 37–58% |
| Opportunities | Karanja ramp-up (3 MMT = 15–20% revenue), IPO capex deployment (new vessels), coastal India scale play, consolidation acquisition target |
| Threats | Admiralty litigation (fleet disruption risk), dry-bulk cycle downturn, top-3 customer loss (−39% revenue), related-party revenue dependency, global shipping oversupply |
A balance sheet with nothing to hide, a multiple with everything to prove.
The company is well-run (low debt, strong cash generation, disciplined capex). The IPO was timely. Karanja terminal and tonnage tax approval are real catalysts. But a 50x P/E on ₹709 Cr revenue and 30% OPM assumes SSGL scales to GE Shipping’s scale and margins within a decade—or grows earnings 15%+ annually on a cyclical commodity base. Neither is guaranteed.
For a shipping and logistics operator, this valuation is aspirational, not instructive.
