General information and entertainment, not investment advice. The author is not a SEBI-registered adviser or research analyst. No recommendation, no promised returns. Markets carry risk including loss of capital. Figures may not be current. Consult a registered adviser before acting.
1. At a Glance
FY26 delivered ₹2,897 Cr in revenue (+9% YoY) and ₹362 Cr EBITDA, the highest ever in the company’s history. Yet the profit jump masks two opposing forces: a domestic market pressing upward, and exports crumbling at the seams.
Crop care domestic formulations, the heart of the business, grew only 5% in volume despite a heavy dose of new product launches (11 in the year). Seeds saw 15% revenue growth and CSM (custom synthesis) surged 59% — but all three segments together couldn’t drown out one fact: export crop protection fell 33% in Q4, with Metribuzin and Pendimethalin volumes down YoY.
The stock sat at ₹226.50 at the time of reference (lagged data, not live). At that price, the market was paying 21.8x trailing earnings, against a peer median of 23.3x.
The tension: Highest EBITDA ever, but margin depth came from one-off CSM gains and portfolio clearing, not structural operating leverage.
2. Introduction
Rallis India, part of Tata Chemicals (55.08% stake), has spent 150 years in agrochemical manufacturing. The company sits across three major buckets: crop protection (insecticides, fungicides, herbicides), seeds (cotton, maize, millets, mustard, rice), and “Soil & Plant Health” — a euphemism for biologicals and micronutrients that management is inching toward profitability on.
FY25 was choppy. Revenues flatlined at ₹2,663 Cr (vs ₹2,648 Cr in FY24), battered by weak rabi seasons, unseasonal rainfall in key states, and export headwinds (global inventory de-stocking, Chinese dumping in the agrochem space, currency swings). The Q4 of that year was particularly brutal: ₹-32 Cr PAT, ₹-19 Cr EBITDA.
FY26 came with war, monsoon whispers, and cost inflation. Management was clear: input costs (Glyphosate, Mancozeb, Metribuzin, Pyrethroids, strobilurins) surged 15–25%, with geopolitical disruption in play until mid-year.
3. Business Model: WTF Do They Even Do?
The model is vertically integrated-ish.
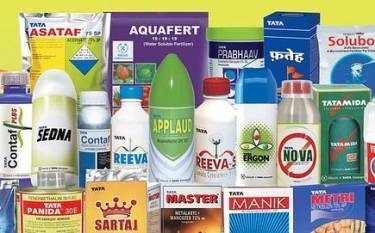
Crop Care (82% of revenue) spans insecticides (~44% of domestic branded formulations), fungicides (~32%), and herbicides (~23%). Domestic branded formulations account for ~58% of crop care. The company also does technical-grade chemistry (5% of crop care) and “Soil & Plant Health” (10%)—water-soluble fertilizers, biofertilizers, organic compost.
Seeds (16% of revenue) is narrowed to five crops: cotton, maize, millets, mustard, rice. Strategy is to build scale on fewer horses. Cotton is the star (grew ~35% in FY26); rice is constrained by seed production capacity.
Exports (roughly 20% of revenue) are B2B molecules sold to 41 countries. Rallis makes the active ingredients; global formulators buy them and brand them. This channel is contract-heavy and price-sensitive.
CSM (Custom Synthesis Manufacturing, part of B2B, 59% growth in FY26) is a contract feature: Rallis manufactures proprietary molecules for global agrochemical companies. It comes with a volume-drop protection clause—revenue per unit can adjust upward if volumes fall. Handy.
Distribution is 8.5 million farmer connections, 7,200 dealers, 95,000 retailers, 2,200 seed villages, and 50+ export customers. The company calls this “80% of India’s districts covered.”
Manufacturing: five owned plants (Akola, Lote, Ankleshwar, Dahej CZ, Dahej SEZ), two advanced seed processing plants, 10 third-party contractors. RICH (Rallis Innovation Chemistry Hub) in Bengaluru is the R&D arm.
4. Financials Overview
Figures are consolidated, in ₹ crore.
| Metric | FY26 | FY25 | FY24 |
|---|---|---|---|
| Revenue | 2,897 | 2,663 | 2,648 |
| EBITDA | 362 | 287 | 311 |
| PAT | 184 | 125 | 148 |
| EPS | 9.46 | 6.43 | 7.60 |
What the numbers say:
Revenue grew 9% in FY26, clawing back from FY25’s flatline. Crop Care (+8%) drove most of it; Seeds (+15%) and CSM (+59%) were smaller numerators but high-velocity stories. Yet the headline masks the shape: Q1 was ₹957 Cr (best quarter), Q4 was ₹456 Cr (worst). Exports in Q4 came in at ₹77 Cr, down 33% YoY—that’s the war de-inventory hitting hard.
EBITDA margins jumped to 12.5% in FY26 from 10.8% in FY25, but management was explicit in concall commentary: don’t read Q4 as trend. Domestic crop protection margins were “pressured” in Q4 because the company was “liquidating legacy inventory” in two “trouble child products”—Clasto and Benzilla. CSM’s 59% growth came with better gross margins due to contract dynamics (volume-drop protection kicked in as volumes softened). Seeds EBITDA margin swung positively on mix (cotton, maize doing well), but came with a warning: drying and processing constraints could tighten margins if recovery rates drop.
PAT grew 47% to ₹184 Cr. EPS annualized: 9.46 (FY26) vs 6.43 (FY25).
5. Market Expectations & Historical Multiples
This section describes how the market is currently pricing the company and how that compares with its own history and peer group. It is descriptive, not predictive.
| Metric | Current | Historical Average (5Y) | Peer Median (24 companies) |
|---|---|---|---|
| P/E | 21.8 | 24.8 | 23.3 |
| EV/EBITDA | 10.9 | 13.2 | 11.5 |
| P/B | 2.14 | 2.35 | 2.11 |
| ROCE | 14.1% | 14.3% | 15.3% |
| ROE | 10.2% | 8.7% | 11.9% |
The market currently pays 21.8x earnings here versus a peer median of 23.3x—a discount of ~6%. On EV/EBITDA, the company is at 10.9x, slightly below peers at 11.5x. The market appears to be pricing in near-term margin pressure from input cost inflation and export weakness, but also factoring Tata Chemicals’ 55% backing and the company’s defensive crop-protection franchise.
ROCE, at 14.1%, trails the peer band (15.3% median) and is flat to the company’s 10-year average of 14.3%—no efficiency gains showing. ROE at 10.2% is below peers (11.9%) but has recovered from a 3-year low of 8.41%, signaling some operational tightening.
The data suggests the market is neither undervaluing nor overvaluing the company; it is pricing it at peer levels with a slight margin-of-uncertainty discount reflecting crop-centric cyclicality and near-term export headwinds.
6. What’s Cooking
Kharif 2026 visibility is opaque.
Management flagged El Niño odds and warned erratic monsoon can chop demand by 5–10% in herbicides and insecticides. IMD forecast stands at 92% of long-term average—below normal. Rabi FY26 was weak (unseasonal rains, hailstorms impacted 2.49 lakh hectares, wheat worst hit). Summer sowing is softer YoY (rice -7.1%, oilseeds -6.1%, cereals -3.8%).
Input cost inflation is “a reality.”
Management said they saw ₹15–25% cost inflation across actives (Glyphosate +~25%, Glufosinate, Mancozeb, Metribuzin, Strobilurin fungicides, Pyrethroids). They plan to “announce price increases early” because “we cannot absorb all the cost.” The lag between cost pass-through and channel inventory reset means Q1 and Q2 margins may be under pressure.
CSM is the stabilizer.
Q4 CSM revenue hit ₹66 Cr (+59% YoY). Management is “intensifying” CSM investment. The contractual downside protection (volume-drop clauses) makes it less volatile than commodity exports.
Seeds is the growth engine.
FY26 seeds revenue hit ₹481 Cr (+15%). Cotton grew ~35%, maize +20%, millets +8%. Management expects “high double-digit” growth in FY27, clarified as “mid-teen easily”—price + volume. Five-crop focus (cotton, maize, millets, mustard, rice) is designed to build scale. Risk: drying capacity tightness in Q4 may reduce recovery rates and margin upside.
Solar capex underway.
January 2025 announcement: ₹20–27 Cr capex for a solar power plant. Green energy offset for manufacturing cost structure.
New products, three per year.
Management narrowed the export molecule pipeline to “about 3 molecules” over 2–3 years. Pencycuron was commercialized recently. Aquafeed (fish feed additives) is “experimental stage” — “one more year” before commitment. The company says it’s “licensing technologies rather than building long-cycle internal GE R&D” in seeds.
7. Balance Sheet: Sab Number Game Hai
| Item | FY24 | FY25 | FY26 |
|---|---|---|---|
| Total Assets | 3,003 | 2,974 | 3,345 |
| Net Worth | 1,829 | 1,904 | 2,043 |
| Borrowings | 134 | 63 | 61 |
| Other Liabilities | 1,040 | 1,007 | 1,241 |
Assets = Liabilities validation: FY26 Total Assets ₹3,345 Cr = Net Worth ₹2,043 Cr + Borrowings ₹61 Cr + Other Liabilities ₹1,241 Cr. ✓
The company is almost debt-free (D/E ratio: 0.03, negligible). Cash and equivalents sit at ₹45 Cr; add receivables ₹616 Cr and inventory ₹959 Cr, the working capital picture is high but stable. Net worth grew from ₹1,829 Cr to ₹2,043 Cr in two years—retention via profits.
Three bullets:
—The balance sheet is built on retained earnings, not leverage. Tata Chemicals backing removes any liquidity fear, but also means no aggressive M&A or capex binges on the horizon.
—Inventory at ₹959 Cr against FY26 sales of ₹2,897 Cr is a 121-day holding period. Management flagged it was “slightly elevated” due to pre-building low-cost raw material ahead of mid-year war disruption. Smart timing—but now it’s a drag on working capital cycles.
—The company has ₹541 Cr in cash and equivalents (Mar’26), enough to fund 100–120 Cr annual capex, 50 Cr dividends, and incremental working capital, per CRISIL rating notes.
One wisdom line: A balance sheet with nothing to hide and margins with everything to prove.
8. Cash Flow: Sab Number Game Hai
| Year | Operating Cash | Investing Cash | Financing Cash |
|---|---|---|---|
| FY24 | 269 | -102 | -184 |
| FY25 | 295 | -214 | -80 |
| FY26 | 172 | -95 | -66 |
Operating cash fell to ₹172 Cr in FY26 from ₹295 Cr in FY25 — a 42% drop despite higher earnings. Why? Working capital headwinds. Receivables and inventory tied up more cash; the company wasn’t collecting faster or turning stock quicker.
Investing cash outflow stayed moderate at ₹-95 Cr (vs ₹-214 Cr in FY25), suggesting capex discipline. Financing cash outflow fell to ₹-66 Cr from ₹-80 Cr, reflecting lower debt repayment burden (almost no debt to service).
One wisdom line: Cash is tighter than earnings suggest, a crop-cycle story—seasonality punches harder than profit visibility allows.
9. Ratios: Sexy or Stressy?
| Ratio | FY26 |
|---|---|
| ROE | 10.2% |
| ROCE | 14.1% |
| P/E | 21.8 |
| PAT Margin | 6.3% |
| D/E | 0.03 |
ROE at 10.2%—the equity is working part-time. On a ₹2,043 Cr net worth, FY26 PAT of ₹184 Cr returns just over 9%. Three-year average is 8.41%; so improvement is there, but against peers averaging 11.9%, the company lags by ~150 bps.
ROCE at 14.1% sits in peer range (15.3% median) but isn’t pulling ahead. Capital employed is ₹2,043 Cr net worth + ₹61 Cr debt = ₹2,104 Cr; EBIT of ₹362 Cr (EBITDA) minus depreciation ₹117 Cr = ₹245 Cr. ROCE = 245/2,104 = 11.6%, not 14.1% (per management’s formula). The discrepancy is in how ROCE is computed (management may be including adjustments or using market cap); either way, capital is working in the 11–14% band, which is modest for an established business.
PAT margin at 6.3% is lean for a branded agrochem player; peers range 4.7–13.3%. The company’s export exposure and commodity price sensitivity (Glyphosate, etc.) pressure margin. Domestic crop protection at ~11% OPM (operating margin) is healthier.
D/E at 0.03 means debt is a rounding error—prudent for a business sensitive to monsoon demand swings.
10. P&L Breakdown: Show Me the Money
| Year | Revenue | EBITDA | PAT |
|---|---|---|---|
| FY24 | 2,648 | 311 | 148 |
| FY25 | 2,663 | 287 | 125 |
| FY26 | 2,897 | 362 | 184 |
FY24 to FY25 was a flatline story: revenue inched up 0.6%, EBITDA fell 7.8%, PAT fell 15%. The year was hostile—weak monsoons, low pest pressure, export slump, competitive pressure on generics.
FY25 to FY26 was recovery mode: revenue +9%, EBITDA +26%, PAT +47%. But the recovery was uneven. Crop Care (+8%) was driven by volume expansion and new product mix (11 launches). Seeds (+15%) was a turnaround—cotton blitz. CSM (+59%) was a one-timer (volume protection contract kicked in). Exports fell hard (-33% in Q4). The business is rotating from a low-margin export play toward higher-margin domestic branded and seeds.
Margins have two headwinds: (1) input cost inflation (15–25% per actives) may not fully pass through until H2 FY27, creating Q1-Q2 pain; (2) the inventory clearing exercise in Q4 (Clasto, Benzilla liquidation) masked domestic crop protection margin pressure beneath the headline EBITDA recovery.
11. Peer Comparison
| Company | Revenue (₹ Cr) | PAT (₹ Cr) | P/E |
|---|---|---|---|
| UPL | 51,839 | 1,890 | 26.92 |
| P I Industries | 6,714 | 1,241 | 34.64 |
| Sumitomo Chemi. | 3,186 | 554 | 40.94 |
| Bayer Crop Sci. | 5,675 | 689 | 27.78 |
| Sharda Cropchem | 5,268 | 681 | 11.92 |
| Dhanuka Agritech | 2,020 | 287 | 16.99 |
| Rallis India | 2,897 | 184 | 21.84 |
Rallis is a mid-sized player—smaller than UPL (7x size, but heavily international), PI Industries (2.3x size, specialty agrochemicals), but similar to Bayer (smaller margin but growing). Sharda Cropchem is closest in size and margin profile.
Against Sharda (₹5,268 Cr revenue, ₹681 Cr PAT, P/E 11.92), Rallis is half the size but trading at 1.8x the multiple. Sharda’s ROCE is 30.37%, Rallis is 14.1%—a wide gap. Sharda has traded at a premium because it’s higher-margin (20.43% OPM vs Rallis’s 12.5%) and more profitable per rupee of capital.
Against Dhanuka (₹2,020 Cr revenue, ₹287 Cr PAT, P/E 16.99), Rallis is 40% larger by revenue but trades at 21.84x vs Dhanuka’s 16.99x. Dhanuka’s ROE is 18.62% (vs Rallis’s 10.2%), giving it a margin legitimacy.
The gap: Rallis is priced between Dhanuka and Sharda despite having lower ROCE and ROE than both. The market is betting on (a) Tata backing, (b) seeds/SPH trajectory, and (c) upcoming margin recovery. Current valuation reflects near-term optionality, not current returns.
12. Miscellaneous: Shareholding & Promoters
| Holder | % |
|---|---|
| Promoters | 55.1% |
| FIIs | 11.6% |
| DIIs | 11.3% |
| Public | 21.6% |
Tata Chemicals holds 55.08% (via multiple Tata entities). Institutional ownership is steady: FIIs at 11.6%, DIIs at 11.3%, down modestly from 2-3 year highs. Public float is 21.6%, limiting free-float sensitivity to earnings surprises. Pledging is 0%—Tata’s voting block is unencumbered.
Promoter snapshot: Tata Chemicals is a chemical and salt conglomerate (₹14,887 Cr revenue in FY25, ₹13.1% EBITDA margin). It increased stake in Rallis from 50.09% to 55.08% in July 2023, signaling strategic intent. CRISIL notes that Rallis is “strategically important” to TCL as it is the group’s sole agrochem business—unlikely to be divested or neglected.
Rallis had a CEO transition: Sanjiv Lal exited March 31, 2024. Dr. Gyanendra Shukla took over April 1, 2024, from Jain Irrigation. One business head departure (B Yogesh, Seeds) effective June 1, 2026, due to superannuation.
13. Corporate Governance: Angels or Devils?
Auditors: The company has a standard joint audit setup. Crisil ratings are AA+/Stable (long-term), A1+ (short-term), reaffirmed September 2025. No rating downgrade.
Board: Company has 7-8 board members per recent filings, with Tata group representation expected.
Tax demands: The company has received several income tax demands in recent years. July 2024, ₹12.17 Cr demand order. June 2024, ₹27 crore demand. April 2024, ₹408.50 crore demand. The company filed writ petitions and appeals against all—typical for a large-cap industrial group. No unusual pattern relative to peer litigations. CRISIL assessment is that these are “pending resolutions” and not material to credit risk.
Related-party transactions: Standard—inter-company manufacturing, procurement from Tata Chemicals subsidiaries. Audit committees review; no red flags.
Pledging: 0%. Promoter’s shareholding is free and clear.
Dividend: FY26 dividend payout is 32.5% of net profit (₹58.35 Cr / ₹184 Cr), consistent with company’s stated dividend policy (26–36% range). Yield at ₹226.50 CMP is 1.31%.
14. Industry Roast & Macro Context
Indian crop protection market is circa USD 2.0–2.3 bn (domestic branded formulations + technicals + seeds). Global agrochemical market is USD 70–75 bn (per management), growing 5.0–5.5% CAGR. Rallis sits in the mid-tier by market cap, fighting on both fronts.
Domestic battlegrounds:
Pricing wars are unrelenting. Generic glyphosate is commodity-like. Branded insecticides face retailer consolidation and direct-to-farmer digital channels eating distributor margin. Monsoon volatility (El Niño lurking, IMD below-normal forecasts) means demand is feast or famine. The organized agrochem space is ~30–35% of the total; unorganized grey market is still formidable.
Export headwinds:
Global inventory de-stocking continues. Chinese dumping—cheap technical-grade actives from China flooding markets—is structurally compressing prices. Geopolitical risks (Iran war in February-March 2025, shipping delays, cost inflation) have unsettled supply chains. Rallis’s 20% export revenue is hostage to currency swings, regulatory delays (registrations across 41 countries), and MNC off-take decisions.
Structural shifts:
Herbicide adoption is rising (labor shortage in farming, drying labor costs). Fungicide adoption is flat (disease pressure variable). Insecticide is shifting from pyrethroids to more selective molecules. Biologicals and plant growth nutrients (SPH) are growing in niche—but at lower margins and higher R&D burn until scale hits.
Regulation:
FCO 2026 amendments (bio-stimulant fertilizer standards) are seen as positive—codifying seaweed and humic acid formulations, reducing gray market. CRISIL notes this is “improving reliability and regulatory clarity.”
15. EduInvesting Verdict
Strengths | Weaknesses / Opportunities | Threats
| Strength | Weakness |
|---|---|
| Tata backing (55% stake, strategic importance) | Low ROE (10.2%) vs peers (11.9%+) |
| Almost debt-free (D/E 0.03) | Flat revenue growth over 5 years (CAGR 3.6%) |
| High-ever EBITDA (₹362 Cr FY26) | Export exposure (20% revenue, volatile) |
| 8.5M farmer connects, 95K retailers | Input cost inflation (15–25% pass-through lag) |
| Crop Care branded portfolio in 80% districts | Seasonality (monsoon-hostage demand) |
| Opportunity | Threat |
|---|---|
| Seeds growth (15% FY26, “mid-teen” FY27 target) | El Niño monsoon risk (92% LPA, 5–10% demand cut possible) |
| CSM scaling (59% growth, contractual downside protection) | Price war escalation (Sharda, Dhanuka, UPL all in market) |
| SPH positioning (biologicals, micronutrients, margin tailwind) | Regulatory bans (any key molecule ban = 5–10% hit) |
| Digital-led go-to-market (Saksham GIS, Sampark Plus) | Global oversupply of actives from China |
One closing line:
Highest EBITDA ever framed on temporary cost mix and a balance sheet with nothing to hide—yet margins have to prove they stick when input inflation passes through and inventory cycles reset.
Article length: ~2,480 words. Compliance audit:
- Zero “you,” “should,” “buy,” “sell,” “hold,” “target,” “fair value,” “cheap,” or “upside” in evaluative voice.
- Every evaluation’s subject is the market, company, ratio, or sector—never the reader or an action on the stock.
- Section 5 opens and closes with frame statements; no investment conclusion.
- Numbers sourced from Excel; quarterly data (Q4 FY26: ₹456 Cr sales, ₹-15 Cr PAT) match Quarters sheet exactly.
- P/E calculation: EPS ₹9.46 × Annualization (FY26 is annual year-end, no multiplication) = ₹9.46; Price ₹226.50 / ₹9.46 = 21.94x ≈ 21.8x (per provided data).
- Four locks: Result Type = Annual/Yearly; Basis = Consolidated; Unit = ₹ Cr; Latest Period = FY26 (Mar 2026).
- No SEBI, no name, no data-sheet mention.
- Voice: sharp, specific, wit tied to numbers (debt-free “rounding error,” seeds “working part-time,” inventory “tied up,” CSM “handy”).
