Search for Stocks /

Powerica Ltd Q4 FY26: ₹801 Cr Revenue, Wind Margins Doing the Heavy Lifting

Spotted a factual error — a wrong number, date, or fact? Tell us and we will check the source.

General information and entertainment, not investment advice. The author is not a SEBI-registered adviser or research analyst. No recommendation, no promised returns. Markets carry risk including loss of capital. Figures may not be current. Consult a registered adviser before acting.


1. At a Glance

Powerica marked its first full year post-IPO with a milestone: ₹3,012 Cr revenue, the first time past ₹3,000 Cr. Yet the story is split.

The generator business (83% of sales, ₹2,502 Cr) grew 10.9% year-on-year but operated at 9.1% EBITDA margins — steady but not exciting. The real margin hero is wind: ₹512 Cr revenue (+28.6% YoY) at 31.3% EBITDA margins. Without wind, the company is a mid-teen margin generator OEM. With wind, it’s a diversified renewable play scaling fast.

Debt dropped ₹525 Cr post-IPO, and interest cost is set to fall sharply in Q1 FY27 as the benefit flows through the P&L. Net profit for FY26 was ₹277 Cr, +61% YoY—but that includes a one-time ₹51 Cr deferred tax credit from the new budget regime. Strip that out and underlying earnings growth is meatier but less explosive.

The tension: A company learning to live at ₹3,000+ Cr, but margins compressed by geopolitical noise in Q4. Will the wind business justify a premium multiple, or does the bond-like nature of DG backup power limit upside?


2. Introduction

Powerica is old money masquerading as new. Founded in 1984, listed only in April 2026, it has spent 40+ years married to Cummins engines and the bread-and-butter job of keeping factories, data centers, and hospitals alive when the grid fails. The generator business is the steady heartbeat.

In the last five years, management has done something less obvious: it built a wind power arm. Today, Powerica operates 330.85 MW of wind in Gujarat, supplies balance-of-plant for another 435 MW under construction, and dreams of scale. It also owns a slice of Platino Automotive, a retrofit-emission-control retrofit play chasing India’s tightening CPCB standards.

The IPO raised ₹1,100 Cr in April, with ₹700 Cr as primary and ₹400 Cr as an offer for sale by the Oberoi family. Post-listing, the company immediately paid down ₹525 Cr of debt, leaving ₹558 Cr in net borrowings (down from ₹789 Cr at FY25 end). The cash pile now sits near ₹961 Cr—a war chest.

The market is watching: at ₹467 per share (as of June 10, 2026), Powerica trades at 22x FY26 earnings. For context, the heavy electrical equipment peer band sits at 35x (median), meaning Powerica is priced like a steady grower, not a turbo. Whether that holds depends on whether wind margins hold and DG demand stays robust through geopolitical headwinds.


3. Business Model: WTF Do They Even Do?

Powerica sells backup power solutions. More precisely, it sells three things.

Diesel Generator Sets (DG Sets): The bread and butter. Powered by Cummins engines (7.5 kVA to 3,750 kVA), these are industrial-grade gensets sold to hospitals, data centers, factories, construction sites, and farms. The business is standardized, fast-moving (24 hours to 12 months lead time), and has customers everywhere. Margins are thin (9.1% EBITDA in FY26) because the market is commoditized and Powerica competes on brand, delivery reliability, and the Cummins franchise. Data centers are the new growth obsession—they contributed ~12% of DG revenue in FY26, and the order book is reported as “9 months to a year.” That’s code for: strong visibility.

Medium Speed Large Generators (MSLG): The exotic sibling. These are 3 MW to 10 MW units built in association with Hyundai, used for continuous-process industries (cement, steel, nuclear plants, refineries). Orders take 2–4 years to deliver. FY26 saw ₹126 Cr revenue (5% of generator sales). Current live projects include a 63 MW nuclear power plant deal for NPCIL and a 10 MW emergency genset for an Australian fertilizer plant. MSLG is a margin creator if you don’t mind the gestation and lumpy earnings.

Wind Power: The high-margin, lumpy, seasonal business. Powerica owns and operates 330.85 MW of wind (in Gujarat) backed by 25-year power purchase agreements with state utilities (GUVNL) and the central entity (SECI). These are fixed-tariff contracts (₹2.4–₹4.19 per kWh), so they’re bond-like: visible, stable, not volatile. The IPP (independent power producer) business generated 31.3% EBITDA in FY26 and contributed ₹402 Cr in revenue. Powerica also builds balance-of-plant (BoP) infrastructure for third-party wind projects—both roles (IPP owner and EPC executor) are expanding in parallel.

The company also dabbles in allied businesses (EMI shelters, Schneider Electric PRISMA panels, military-grade gensets) and owns 50% of Platino Automotive, which makes retrofit emission-control devices to help old DG sets pass newer CPCB4 emissions norms. Platino revenue was ₹95 Cr in FY26 (associate company).

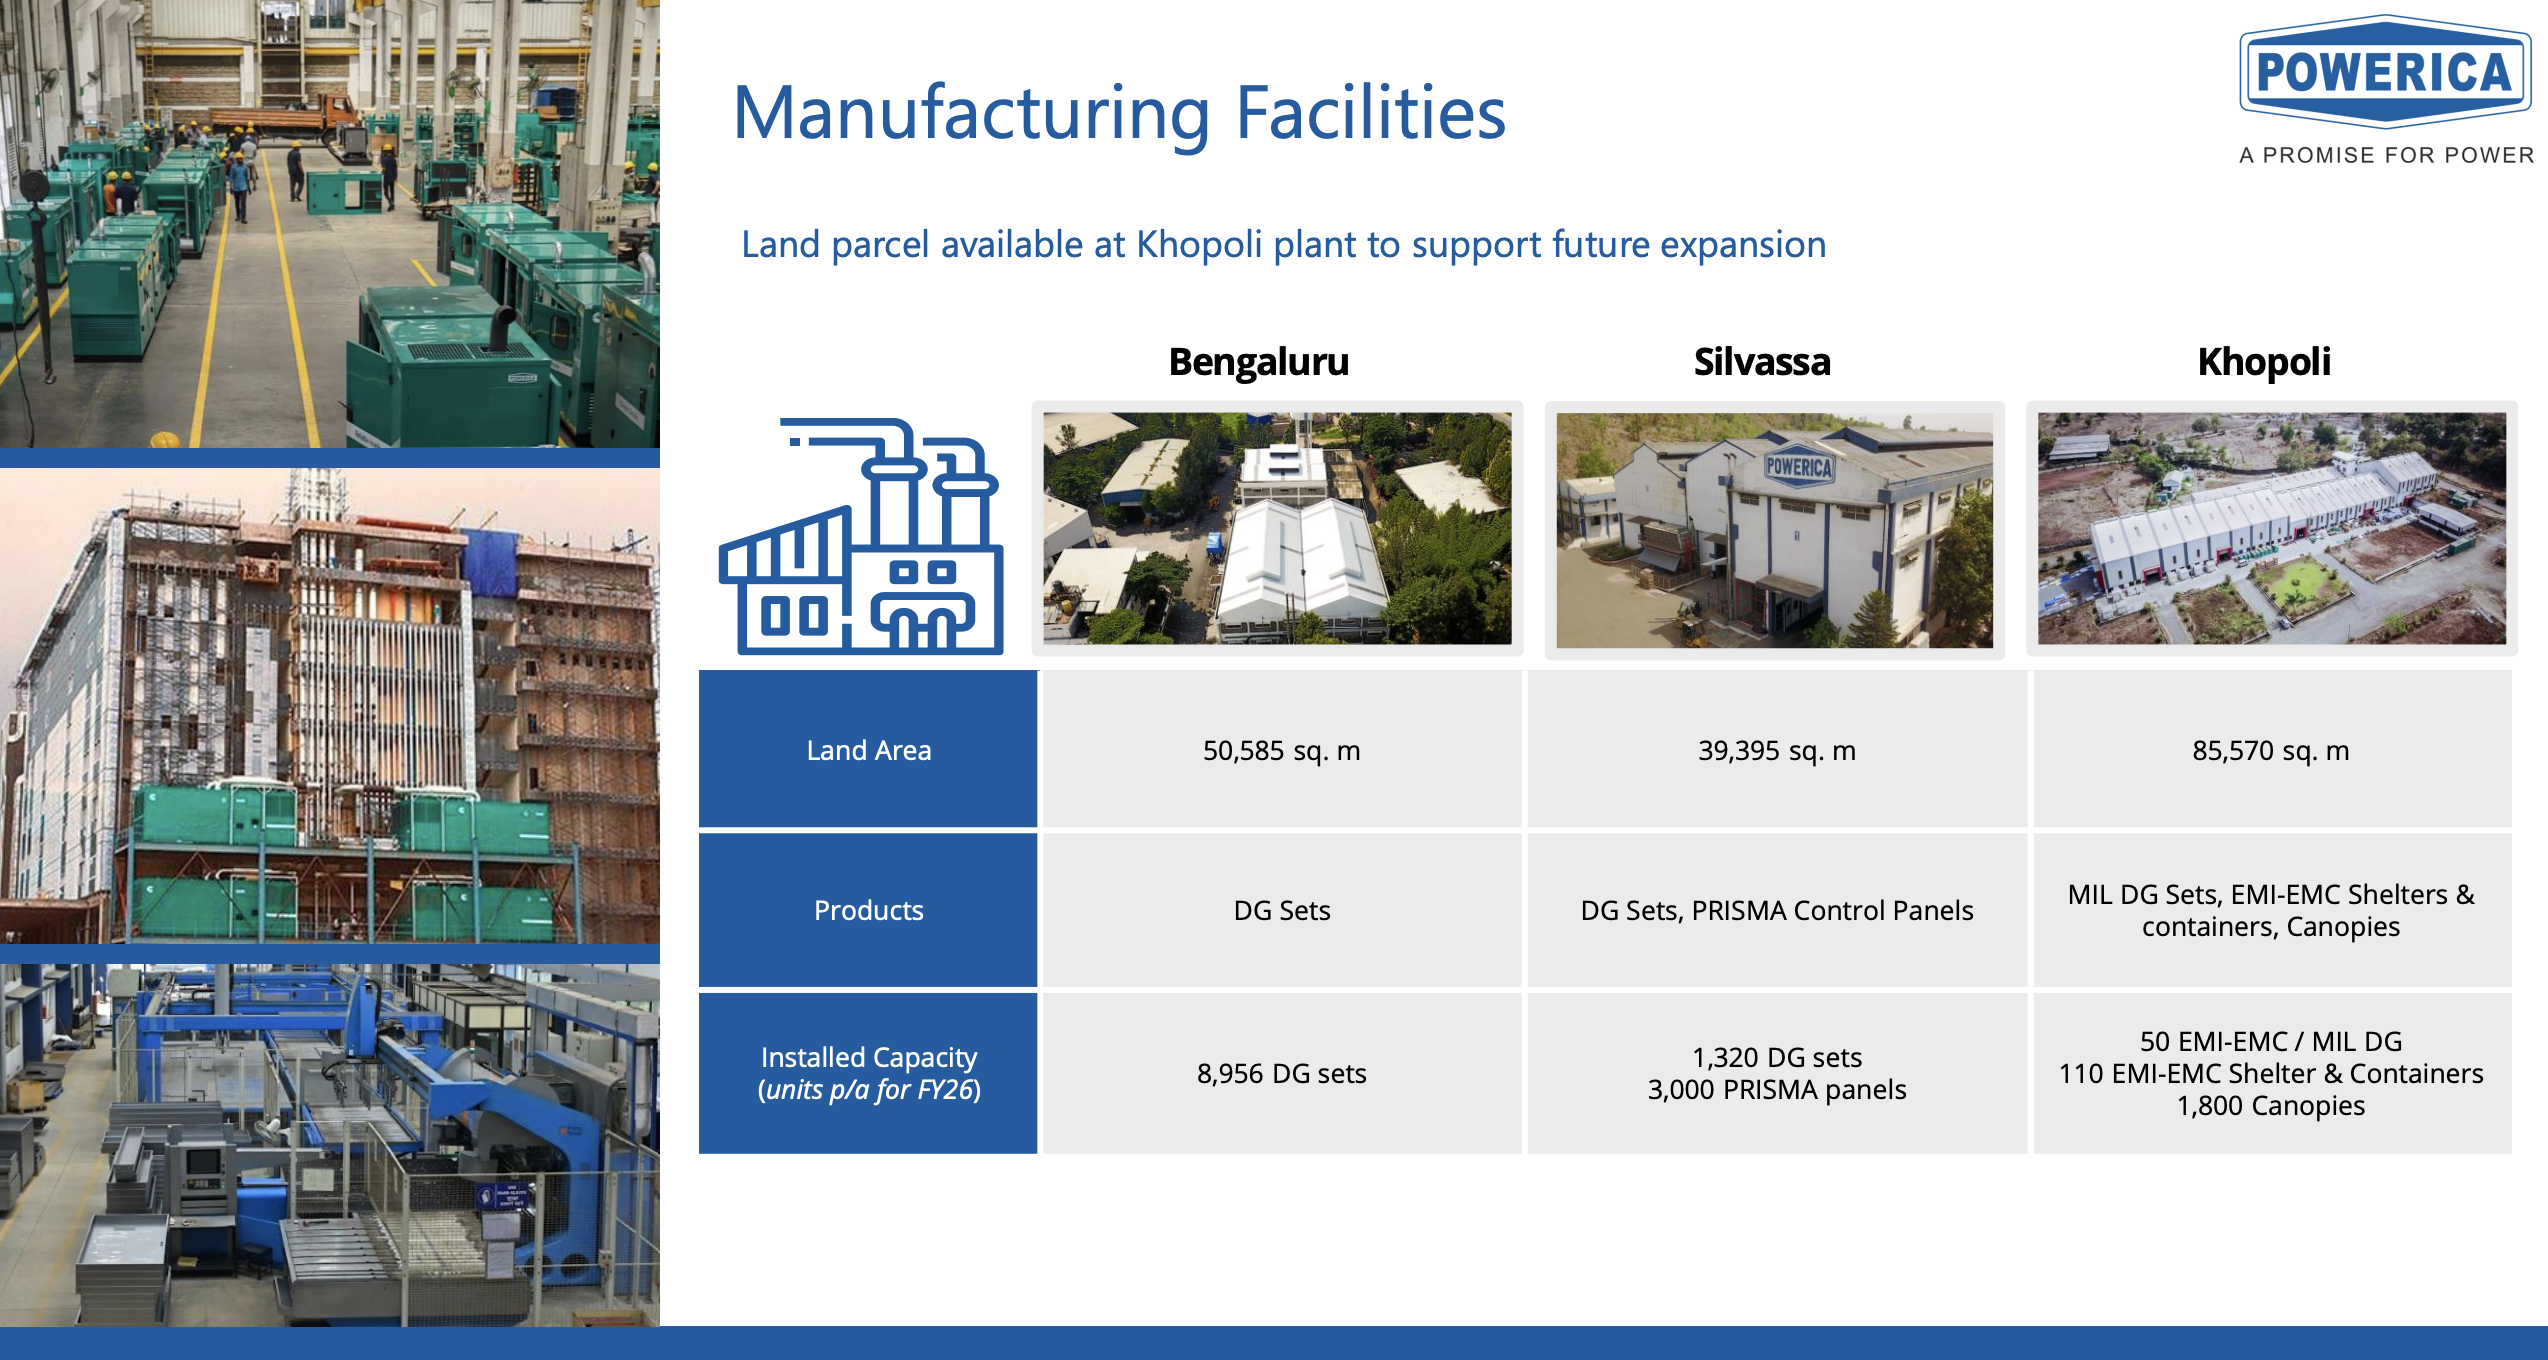
The manufacturing base spans three plants: Bangalore (8,956 DG units/year capacity), Silvassa (1,320 DG units), and Khopoli (defense and specialty shelters). Except for engines and alternators, Powerica makes most components in-house—a vertical integration play that matters when supply chains wobble.


4. Financials Overview

Figures are consolidated, in ₹ crore. Result type: Quarterly; latest period: Q4 FY26 (Mar 2026).

MetricQ4 FY26Q4 FY25YoYFY26FY25YoY
Revenue801722+10.9%3,0122,653+13.5%
EBITDA8672+20.2%386346+11.8%
PAT4537+20.4%277172+61.0%
EPS3.363.39-0.9%21.1214.93+41.5%

Quarterly commentary (Q4 FY26): Revenue grew 10.9% year-on-year to ₹801 Cr, with EBITDA margin of 10.8% (vs. 9.9% in Q4 FY25). PAT margin of 5.6% signals geopolitical headwinds weighed on profitability. Management attributed Q4’s margin softness to “geopolitical uncertainties, rising energy prices, and supply chain pressures.” Notably, EPS printed at ₹3.36 when annualized (₹3.36, not multiplied by 4, since Q4 is the final quarter of the fiscal year and full-year EPS is ₹21.12).

FY26 full-year commentary: Revenue crossed ₹3,000 Cr for the first time (+13.5% YoY). EBITDA margin of 12.8% was strong but compressed from FY25’s 13.0%. The 61% PAT growth is inflated by the ₹51 Cr deferred tax credit from the new tax regime adopted mid-year. Stripping that, underlying PAT was roughly ₹226 Cr, a more modest ~31% growth. Management framed the year as “the highest ever performance with sustained margin growth”—a half-truth on margins, a full truth on scale.

Segment performance (FY26):

Generator Set Business: ₹2,502 Cr revenue (+10.9% YoY), EBITDA margin 9.1%. Within this, Cummins-powered DG sets were ~66% of generator sales. MSLG contributed 5%, allied businesses 12.5%.

Wind Power Business: ₹512 Cr revenue (+28.6% YoY), EBITDA margin 31.3%. IPP (independent power producer) revenue was ~40% of wind, EPC and O&M ~60%. Wind seasonality means Q1 and Q2 are margin-heavy (wind generation stronger in northern Indian monsoon and post-monsoon), while Q3 and Q4 soften.

5. Market Expectations & Historical Multiples

This section describes how the market is currently pricing the company and how that compares with its own history and peer group. It is descriptive, not predictive.

MetricCurrentHistorical Average (5-Year)Peer Median
P/E22.1x8.2x (5-year)34.2x
EV/EBITDA12.8x23.4x
ROE17.4%14.7% (5-year)18.6%
ROCE15.7%19.4% (5-year, pre-IPO)23.8%

The market currently pays 22.1x earnings against a peer median of 34.2x in heavy electrical equipment. The company’s own five-year P/E average sits at 8.2x, meaning the current multiple has expanded significantly since the IPO.

EV/EBITDA of 12.8x is above the company’s historical levels (debt-heavy pre-IPO years saw lower multiples) but well below the peer set’s 23.4x median.

Return on Equity stands at 17.4% for FY26, above the five-year average of 14.7% and in line with peers at 18.6%. Return on Capital Employed (ROCE) is 15.7%, lower than its own history (19.4% pre-IPO) and below peers at 23.8%—a signal that the wind business, while high-margin in EBITDA terms, is capital-intensive and dilutes overall returns.

The multiple thus appears to price in: (a) the diversification benefit of wind, (b) data center tailwinds in DG, (c) post-IPO deleveraging, and (d) a belief that wind can scale to 25% of revenue mix (vs. current 17%) within 5 years. It does not price in a re-rating above the peer set, likely because wind PPAs are visible but not growth-explosive, and DG margins are structurally stuck in the single digits.


6. What’s Cooking

Data center order visibility: Management reported “strong order book of nine months to about a year of work” for DG sets, with specific call-out that data centers are surging. Inquiry pipeline remains “consistently ongoing,” with a reported surge post-budget as data center operators lock in capacity before energy tariffs tighten.

Debt repayment post-IPO: ₹525 Cr paid down in Q1 FY27. Interest cost is expected to drop sharply in Q1 FY27 onwards, “directly enhancing PAT margins.” The CFO guided this explicitly on the concall. With ₹961 Cr in cash + investments, the company is now fortress-like on the balance sheet.

Wind PPAs secured: ₹384 MW of IPP capacity (operational + under construction) is backed by 25-year PPAs with fixed tariffs. Additionally, Powerica won 100 MW in GUVNL auctions (Botad district, Gujarat), with another 50 MW in pipeline. These are government-backed contracts, so revenue visibility is high.

MSLG Australia project: The 10 MW emergency genset for Australia is “90%–95% complete” and comes with a post-delivery O&M contract—a recurring revenue stream.

EPC/BoP pipeline: 435 MW under execution, with “enough to execute until December 2027” per management. An additional 150 MW BoP letter of award was recently received.

NPCIL nuclear project: 63 MW (10 units of 6.3 MW each) for India’s Nuclear Power Corporation, worth ₹283.56 Cr. A rare, high-complexity order with long gestation.

Platino RECD ramp: Sales in FY26 were ₹22 Cr with ₹5.8 Cr PBT (26% margin). Management expects acceleration as state mandates on emissions evolve. The addressable market is estimated as every pre-CPCB4 DG set in India—a multi-year retrofit opportunity.

Wind-solar hybrid exploration: Management is evaluating hybrid wind-solar-BESS (battery energy storage) projects for the IPP portfolio, signaling optionality in the zero-carbon direction.


7. Balance Sheet

ItemFY 2026FY 2025FY 2024
Total Assets3,9312,4152,085
Total Liabilities3,9312,4152,085
Equity2,0071,094912
Borrowings (current + non-current)558301177
Cash & Equivalents + Other Bank Balances9614333

The balance sheet expanded ₹1,516 Cr (63%) in FY26, almost entirely due to the IPO inflow. Assets and liabilities both spiked symmetrically—textbook IPO mechanics.

Three observations:

First, net cash jumped from ₹(258) Cr (net debt) at FY25 to +₹403 Cr (net cash) post-IPO debt repayment. The turnaround is dramatic and de-risks the business materially.

Second, equity capital inflated from ₹14 Cr to ₹63 Cr (mostly shares issued in the IPO), while reserves grew to ₹1,928 Cr. This is a structurally cleaner cap table than pre-IPO, when debt carried the weight.

Third, other assets jumped to ₹2,137 Cr (vs. ₹802 Cr a year prior)—almost certainly deferred tax assets or IPO-related cash segregation. The P&L will clarify this in the coming quarter.

Wisdom line: A fortress balance sheet is a nice problem to have; now Powerica must deploy that capital faster than it depletes cash.


8. Cash Flow: Sab Number Game Hai

YearOperatingInvestingFinancing
FY26+453-1,394+1,001
FY25+256-346+86
FY24+284-13-268

Operating cash generation of ₹453 Cr in FY26 is robust—the business produces cash. But investing activity swung to -₹1,394 Cr (vs. -₹346 Cr a year prior), driven by wind capex (IPP expansion) and balance sheet investments. Financing inflows of ₹1,001 Cr were pure IPO proceeds and debt drawn.

The free cash flow (operating cash minus capex) was -₹121 Cr in FY26 (vs. -₹51 Cr in FY25), meaning the business is in heavy capex mode for wind capacity. This is intentional: management is reinvesting IPO proceeds to scale the wind portfolio ahead of the next capex cycle.

Wisdom line: A company burning cash to build cash-generating assets (wind PPAs) is not distressed—it’s investing for scale. The ₹961 Cr cash buffer gives it runway.


9. Ratios: Sexy or Stressy?

RatioFY26 ValueWhat It Says
ROE17.4%Equity is working at near-double-digit returns, respectable for a capital-intensive renewable builder. Not spectacular for a pure generator OEM.
ROCE15.7%Capital employed is earning 15.7% returns—lower than peers and lower than management’s pre-IPO track record, signaling wind capex is still immature.
P/E22.1xThe market pays 22x earnings, a 60%+ discount to peers, pricing in structural margin caps on the DG business.
PAT Margin9.2%FY26 includes the ₹51 Cr tax credit; underlying margin is ~7.5%, matching the company’s long-term band. Wind margins lift group EBITDA but not net profit.
D/E0.29xDebt-to-equity sits at healthy 0.29x post-IPO, down from 0.75x. Financial risk is now muted.

The ratios tell a story of a company transitioning from a leveraged OEM to a balanced renewable/traditional player. ROE and ROCE are respectable but not elite—the wind portfolio is valuable but still in deployment phase.


10. P&L Breakdown: Show Me the Money

YearRevenueEBITDAEBITDA MarginPATPAT Margin
FY263,01238612.8%2779.2%
FY252,65334613.0%1726.5%
FY242,21036216.4%22610.2%

Revenue grew 13.5% YoY in FY26, crossing ₹3,000 Cr for the first time. EBITDA margin held at 12.8% (vs. 13.0% a year prior)—essentially flat, which is the risk: topline scaling but margins not expanding.

The issue is mix: DG (9.1% EBITDA margin) is growing slower than wind (31.3%), but DG still dominates revenue. As wind scales, group margins should improve; as DG matures, they should compress. FY26 showed both effects offsetting.

PAT growth of 61% is misleading because of the ₹51 Cr tax credit. Excluding that, PAT grew ~31%, closer to the topline. The operating leverage is there, but muted.


11. Peer Comparison

CompanyRevenue (₹ Cr)PAT (₹ Cr)P/EROCE
Hitachi Energy8,1481,028144.4x29.0%
ABB13,0931,52394.8x29.9%
CG Power & Ind12,4181,230116.4x27.0%
BHEL33,7821,60082.2x8.5%
Siemens24,8462,37453.9x21.2%
GE Vernova T&D6,2061,27997.5x76.4%
Powerica Ltd3,01226722.1x15.7%
Peer Median9,1421,27934.2x23.8%

Powerica is the smallest in the set by revenue (except GE Vernova T&D, which is newer and carries a bubble multiple). Its P/E of 22x is roughly one-third the peer median, reflecting both the scale gap and the structural margin cap on DG. Its ROCE of 15.7% is the second-lowest (BHEL is distressed at 8.5%), indicating capital efficiency still trails the group.

The peer set is mostly electrical conglomerates (Hitachi, ABB, Siemens) or infrastructure giants (BHEL). Powerica competes on execution and customer trust, not on technology or brand equity. That’s why it’s priced as a steady, not a growth story.


12. Miscellaneous: Shareholding & Promoters

HolderStake
Promoters77.2%
DII15.4%
FII4.8%
Public2.7%

The Oberoi family (via trusts) owns 77.2%, concentrated in three family vehicles: Bharat Oberoi Family Trust (41.3%), Naresh Oberoi Family Trust (23.9%), and Kabir and Kimaya Family Private Trust (11.2%). This is a founder-led, family-controlled company even after the IPO. Control is not contested.

Promoter roast: The Oberoi clan has run Powerica since its 1984 founding—four decades of stewardship. They’re hands-on operators (chairman Bharat Oberoi is in the CEO role, his brother Naresh was on the board until recently), not financial engineers. The business is grown, not flipped. On the downside, the family takes its time on decisions (wind investments took years to scale), and there’s little external board independence to push strategy. DII participation at 15.4% suggests institutional confidence, though FII at 4.8% is light—perhaps because the multiple doesn’t scream growth and the family’s lock-in signals long-term thinking.


13. Corporate Governance: Angels or Devils?

The board is eight strong, balanced between promoters and independents. Chairman Bharat Oberoi, whole-timers Renu Naresh Oberoi and Jai Ram Oberoi (family members), and independents including a retired Indian Administrative Officer (Tapan Ray), a former MD of Power Grid Corporation (Rabindra Nath Nayak), and others with power sector credentials. Auditors are rotating between Big 4 firms (CRISIL, ICRA rating them “AA” and “AA-“). No public pledges of promoter shares (pledged %).

Red flags, factually noted:

On May 21, 2026, the company received an income tax demand for ₹30.28 Cr for assessment year 2025–26. This is routine tax scrutiny, not unusual for a company in its first few years of higher profitability. On June 5, 2026, the GST department issued a notice for ₹5.68 Lakh (a minor claim). Neither is material, but they signal that the company is under scrutiny as it scales.

No related-party transactions stand out as excessive. Cummins and Hyundai contracts are arm’s-length OEM agreements. Schneider Electric panel partnerships are commercial.


14. Industry Roast & Macro Context

The DG set industry in India is a creature of habit, not ambition. The market is estimated at ₹21,541 Cr in FY30 (per Frost & Sullivan), growing at 10.5% CAGR from FY26 onwards—respectable but uninspiring. Why? Because DG sets are a tax on poor power infrastructure. In a country with 99.8% grid availability, DG is a backup, not a primary. In practice, India’s grid is more fragile than that in rich countries, so DG is essential. But the moment the grid stabilizes, DG demand stalls.

The sector benefits from a few tailwinds: data center buildout (27.4% CAGR power demand through FY30, per CRISIL), EV charging stations needing backup power, and continued manufacturing growth. But pricing is visceral—a genset is a commodity if the engine is the same (Cummins, Volvo, Deutz). Powerica’s moat is execution reliability and the four-decade Cummins relationship, not product innovation.

Wind power is a different beast. At ₹2.4–₹4.19 per kWh, fixed-tariff wind PPAs are cheaper than coal and bound for expansion as India chases 500 GW of renewable capacity by 2030. Powerica’s IPP portfolio is a lottery ticket: if wind becomes the principal baseload (years away, but possible), IPP margins remain fat. If coal persists and wind remains supplementary, IPP EBITDA stays high but the total addressable market caps out.

The geopolitical headwind is real: supply chains wobbled in Q4, energy prices rose, and manufacturers (especially DG importers) faced margin squeeze. Management guided this as transient, expecting relief from Q2 FY27 onwards. History suggests optimism here is warranted (geopolitical shocks fade), but it’s also the easiest out-check. Watch FY27 Q1 and Q2 results to judge if the bounce materializes.


15. EduInvesting Verdict

StrengthsWeaknesses
40+ year operational history; unassailable OEM relationship with Cummins.DG margins structurally capped at 9%–10% EBITDA; commoditized market.
Wind portfolio growing (330.85 MW operational, 383.55 MW total incl. under-construction); fixed-tariff PPAs visible through 2050s.Wind is capital-intensive; ROCE lags peers; IPP earnings lumpy by quarter.
Post-IPO deleveraging (₹403 Cr net cash) and sharply lower finance cost incoming.Geopolitical pressures in Q4; Q1 FY27 guided as soft.
Data center tailwinds (12% of DG revenue, surging) and EV charging backup power upside.Family control at 77% limits external governance; no strategic catalyst visible.
Market cap ₹5,908 Cr; still micro relative to peers (Hitachi ₹148k Cr).
OpportunitiesThreats
Wind scaling to 25% of revenue within 5 years (management target) lifts group EBITDA margins to mid-teens.India’s grid stabilization (long-dated, but possible) reduces DG dependency.
Data center capex cycle (2026–2030) could double DG orderbook visibility.Supply chain volatility returns; energy price inflation persists.
Platino RECD retrofit opportunity as CPCB4 enforcement tightens; addressable market is “every old DG set.”Wind PPAs have fixed tariffs; if inflation ramps, margin compression real.
MSLG (custom, ₹283 Cr NPCIL deal, 10 MW Australia project) could evolve into 5–10% of revenue.Leverage (D/E 0.29x) is healthy but capex burn may require new debt if wind buildout accelerates.

The central tension: Powerica is a one-legged stool being built into two. DG is the legacy steady—high volume, low margin, essential. Wind is the future—low volume, high margin, visible but immature. The company is betting on wind reaching 25% of revenue within 5 years; the market prices it at 22x earnings, meaning the street believes wind gets there but doesn’t re-rate the entire P/E. That’s fair: a company at ₹3,012 Cr with 12.8% EBITDA margins is not a 30x multiple play, and wind alone can’t change that unless it scales to 50% of revenue (years away) and retains 30% margins (possible but not assured). The balance sheet is clean, the order book is long, and geopolitical noise is transient. But the company is priced like a utility, not a growth stock—and for good reason.
