General information and entertainment, not investment advice. The author is not a SEBI-registered adviser or research analyst. No recommendation, no promised returns. Markets carry risk including loss of capital. Figures may not be current. Consult a registered adviser before acting.
1. At a Glance
FY26 threw a curveball: revenue jumped 15% year-on-year to ₹940 crore, but net profit collapsed 27% to ₹63.2 crore.
The catch was capex. A ₹300 crore greenfield Indore plant spent the entire year as fixed-cost deadweight—ramp-up delayed to December 2024 / January 2025. Management called FY26 deliberately “heavy,” expecting the unit to show teeth from FY27 onward.
Q4, however, told a different story. Revenue hit ₹252 crore (highest quarterly ever), EBITDA margin returned to 17.7%, and PAT more than doubled YoY to ₹20.6 crore. The Indore facility reached 30% utilization and EBITDA breakeven in Q4.
Working capital also blew up. Receivables stretched to 115 days as the company switched temporarily from stockist-led to hospital-direct billing. A ₹22 crore revenue headwind spread across Q2–Q4, management said, but collection is now near-complete.
The stock trades at 59x FY26 earnings. The market is pricing in that Indore actually works.
2. Introduction
Gufic Biosciences is a mid-cap injectables manufacturer—50+ years in the business, 72.5% promoter-held by the Choksi family.
It lives in three worlds: domestic branded (Critical Care, Infertility, Aesthetics), contract manufacturing (CMO for 70+ companies including Abbott, Cipla, Serum Institute), and a nimble international arm filing in regulated markets.
The Navsari plant in Gujarat produces lyophilized injections, liquid ampoules, APIs, and Botulinum Toxin (in partnership with Prime Bio, USA). Belgaum handles herbal formulations and APIs.
Two years back, the company bet ₹300+ crore on Indore. It’s a capex bet that margins stay at 18%+ once the unit hits scale, and that India’s highly regulated contract-manufacturing playground will reward capacity, especially for complex injectables (carbapenems, liposomal amphotericin-B, gonadotropins, immunological compounds).
A hiccup: FY26 saw 1.6% revenue growth and margin compression. Concall commentary blamed API price drops, inventory adjustments in critical care, and the Indore ramp delay. But Q4 signals recovery starting.
3. Business Model: WTF Do They Even Do?
Gufic makes four things.
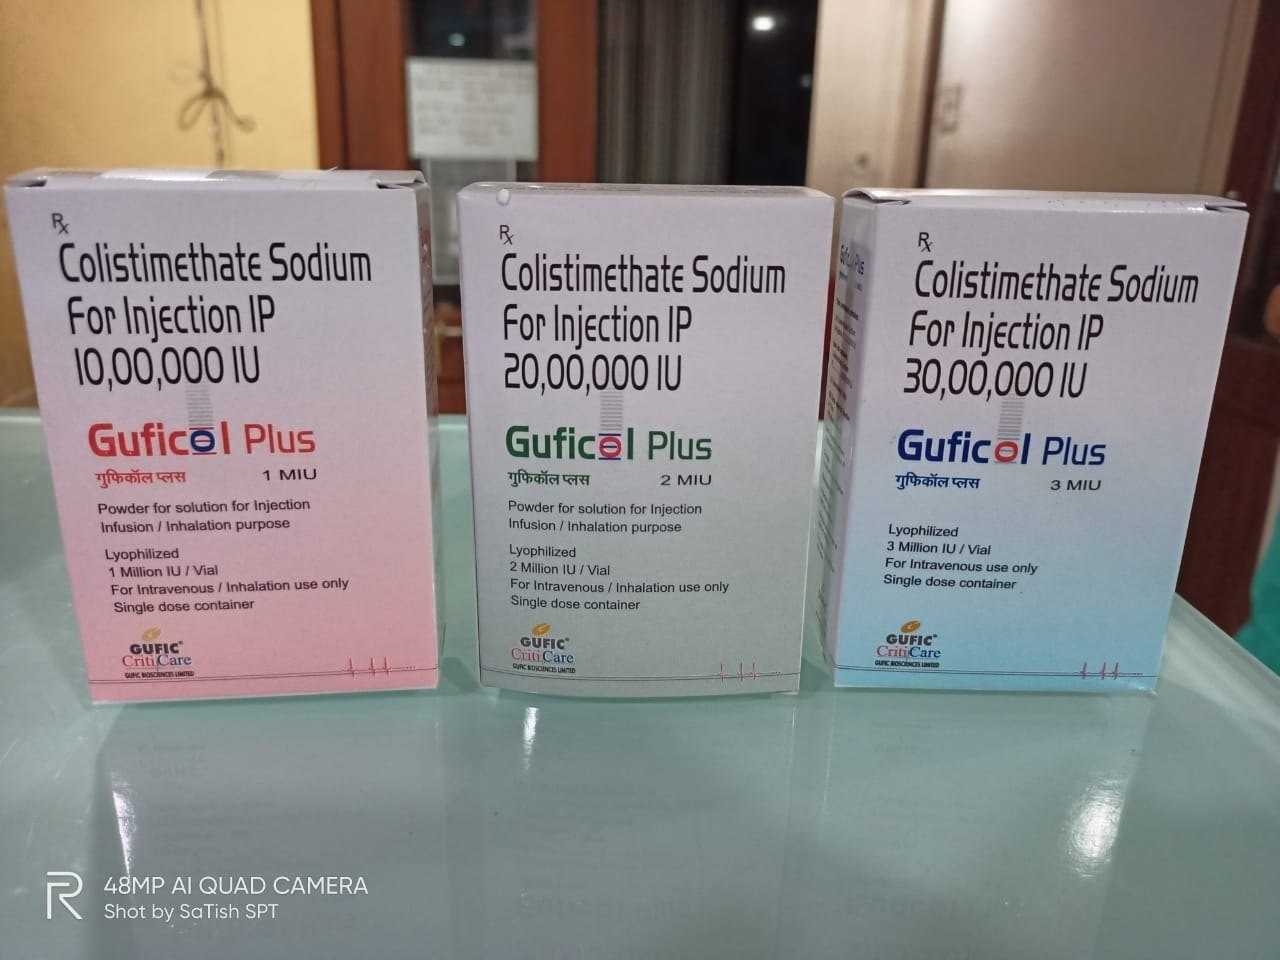
Domestic Branded (~50% of revenue). Injectable-centric: critical care (pain, infection, anesthesia), infertility/fertility (gonadotropins), dermatology (anti-fungals, Botulinum Toxin), herbal tablets. 30,000+ prescriber network, 1.1 lakh retail touch-points, ₹120 crore doctor reach. Brands like Ferticare (gonadotropins, now category leader), Candid (antifungal), Botulax (toxin). Therapeutic areas number 15+, products 100+, SKUs 200+. The category earning the highest margin is injectables: these are small-volume, high-price, low-margin-pressure bets.
Contract Manufacturing (~20% of revenue). Gufic makes formulations for other companies. 70+ clients, 150+ products in portfolio, heavy on complex injectables (Doxycycline, Tigecycline, Liposomal Amphotericin B, Remdesivir, Micafungin). This business insulates from branded domestic pricing pressure but locks Gufic into margin-light relationships.
International Business (~22% of revenue). The company files in 30+ countries, has 130+ registered products, and serves North America, Latin America, Europe, Africa. Strategy is shifting: management says it’s moving from “distributor-holds-marketing-authorization” (Gufic as price-taker) to “Gufic holds IP and MA through Gufic Ireland” (Gufic as price-maker). This shift requires front-end dossier cost and headcount but intends to lock in economics.
Bulk Drugs/APIs (~8% of revenue). Novel API development, peptides, cyclopeptides. Outsourcing reduction story: management says the mix has moved from 80-85% outsourced to ~65%, aiming for 50% in-house eventually. Regulatory independence (own API = no vendor lock), cost control (buy at 100, make at 70), and supply assurance (niche peptides, low volumes).
The stitching: Indore is supposed to be the throughput machine—lyophilized vials, liquid ampoules, cartridges/pens. Navsari stays the export/CMO fortress. API work gets deeper in-house.
Risks? Distribution churn (hospital direct was painful). Price erosion in critical care despite volume growth. CMO margins. Capex payback uncertainty.
4. Financials Overview
Figures are consolidated, in ₹ crore.
Metric
Q4 FY26
Q4 FY25
QoQ Change
FY26
FY25
YoY Change
Sales
252
205
+23%
940
820
+15%
EBITDA
45.9
27.0
+70%
152.9
138.6
+10%
PAT
20.6
8.0
+158%
63.2
69.9
-10%
EPS (₹)
2.05
0.79
+160%
6.30
6.97
-10%
Q4 FY26 Performance. Management called it the inflection. Revenue of ₹252 crore was the highest quarterly number in company history. EBITDA of ₹45.9 crore rebounded sharply, restoring a 17.7% margin after Q4 FY25’s soft 13.2% margin. PAT more than doubled year-on-year to ₹20.6 crore.
EBITDA is reconstructed as PBT (₹27.6 cr) + Interest (₹9.4 cr) + Depreciation (₹7.6 cr) = ₹44.7 cr (management reported 44.7, we derive 44.6 from line items).
FY26 Full Year. Revenue grew 15% to ₹940.5 crore. But the path was lumpy. Q1–Q3 saw moderation and working capital shock. EBITDA margin compressed to 16.3% (vs. FY25’s 16.9%) because Indore’s ₹30 crore fixed-cost drag sat idle. Interest cost jumped to ₹36.6 crore (from ₹24.5 in FY25) due to debt raised for capex and working capital burn.
Full-Year P&L Math. Operating Profit (EBITDA) came to ₹152.9 crore. Minus interest (₹36.6 cr) and depreciation (₹30.8 cr) gives PBT of ₹85.5 crore. Tax of ₹22.3 crore (26% rate) leaves PAT at ₹63.2 crore.
The profit decline (₹69.9 cr in FY25 → ₹63.2 cr in FY26) was entirely a function of higher interest and the margin compression. Operating momentum existed; financing and capex costs masked it.
Concall Color. Management guided for 15% revenue growth in FY27 (“INR 1,075 crore” ballpark), with FY27 EBITDA margin expected around 18% post-Indore ramp-up. By FY30, margin target is above 20%. Gross margin is expected to improve 0.5–1% YoY despite higher registration/dossier costs, driven by product mix and business model shift (distributor-led → MA-led, MA-led → higher-value).
5. Market Expectations & Historical Multiples
This section describes how the market is currently pricing the company and how that compares with its own history and peer group. It is descriptive, not predictive.
Metric
Current
5-Year Average
Peer Median (Pharma)
P/E
59.0x
35.8x
32.0x
EV/EBITDA
26.4x
n/a
n/a
P/B
5.6x
n/a
3.6x
ROE
9.5%
13.5%
12.5%
ROCE
12.2%
n/a
15.1%
The market currently pays 59x FY26 earnings here. The company’s own 5-year average P/E sits at 35.8x, suggesting the current multiple sits 65% above historical norm. Peer medians (Sun Pharma at 34.8x, Divi’s at 67.2x, Lupin at 18.2x, Cipla at 29.5x) center around 32x. Gufic’s 59x sits in the upper quartile.
EV/EBITDA lands at 26.4x (enterprise value ₹4,045 crore ÷ EBITDA ₹152.9 crore). Peer medians range from 15–25x depending on growth and margins.
ROE is 9.5% (PAT ₹63.2 cr ÷ net worth ₹664.2 cr), below the company’s own 3-year average of 13.5% and the peer median of ~12.5%. The weakness is temporary: FY26 PAT was compressed by capex interest drag. As Indore ramps and interest costs normalize, return on equity should recover.
ROCE is 12.2% (EBIT ~₹122 cr ÷ invested capital ~₹1,069 cr). Below the 5-year historical average and below peer median of ~15%. Again, a temporary artifact of asset-heavy, pre-revenue ramp-up phase.
The market appears to be pricing in Indore success—that Q4 inflection is real, that FY27 guidance is achievable, and that margins expand in the ₹1,075+