General information and entertainment, not investment advice. The author is not a SEBI-registered adviser or research analyst. No recommendation, no promised returns. Markets carry risk including loss of capital. Figures may not be current. Consult a registered adviser before acting.
1. At a Glance
Zelio E-Mobility scaled revenue to ₹303.54 Cr in FY26 (up 77% YoY), with net profit reaching ₹28.03 Cr (up 75% YoY from ₹16.01 Cr). The company now claims 70,000+ two-wheeler units shipped in the fiscal year.
The headline tension is acute: the P/E sits at 42.3x while three-year ROE stands at 53% and ROCE at 38.4%. A 10.7x book-value multiple reflects IPO timing (October 2025) and the low-speed EV segment’s current narrative.
Capital intensity looms—four plants now operational, three came online in FY26 alone. Cash from operations turned negative (−₹7.39 Cr vs. −₹9.57 Cr prior year), though net cash flow swung positive at ₹25.69 Cr after financing inflows of ₹42.37 Cr.
The question: Does the company’s growth rate and emerging scale justify the valuation, or is it purely momentum pricing?
2. Introduction
Zelio E-Mobility manufactures electric two-wheelers (Zelio brand) and three-wheelers (Tanga brand) across Haryana, Odisha, Tamil Nadu, and Gujarat. The business is just over a decade into profitability and four years into what management calls a “121% revenue CAGR” expansion from ₹12.89 Cr (FY22) to ₹303.54 Cr (FY26).
The company went public in October 2025 at a ₹75 Cr IPO (₹62.84 Cr net), listing on BSE SME with a ₹1,186 Cr market cap at current prices.
Zelio targets the low-speed two-wheeler segment (₹50–75k price band, no mandatory registration), which management characterizes as an “8–10 lakh units per year” category growing at 20–25% annually. The company claims 5% market share in this segment as of FY26.
Recent announcements: Divyanshu Agarwal took over as CEO in April 2026 (previously of Navi); the Odisha plant (60,000 units) commenced operations in February 2026; Tamil Nadu and a dedicated three-wheeler facility in Haryana both went live in July 2026.
3. Business Model: WTF Do They Even Do?
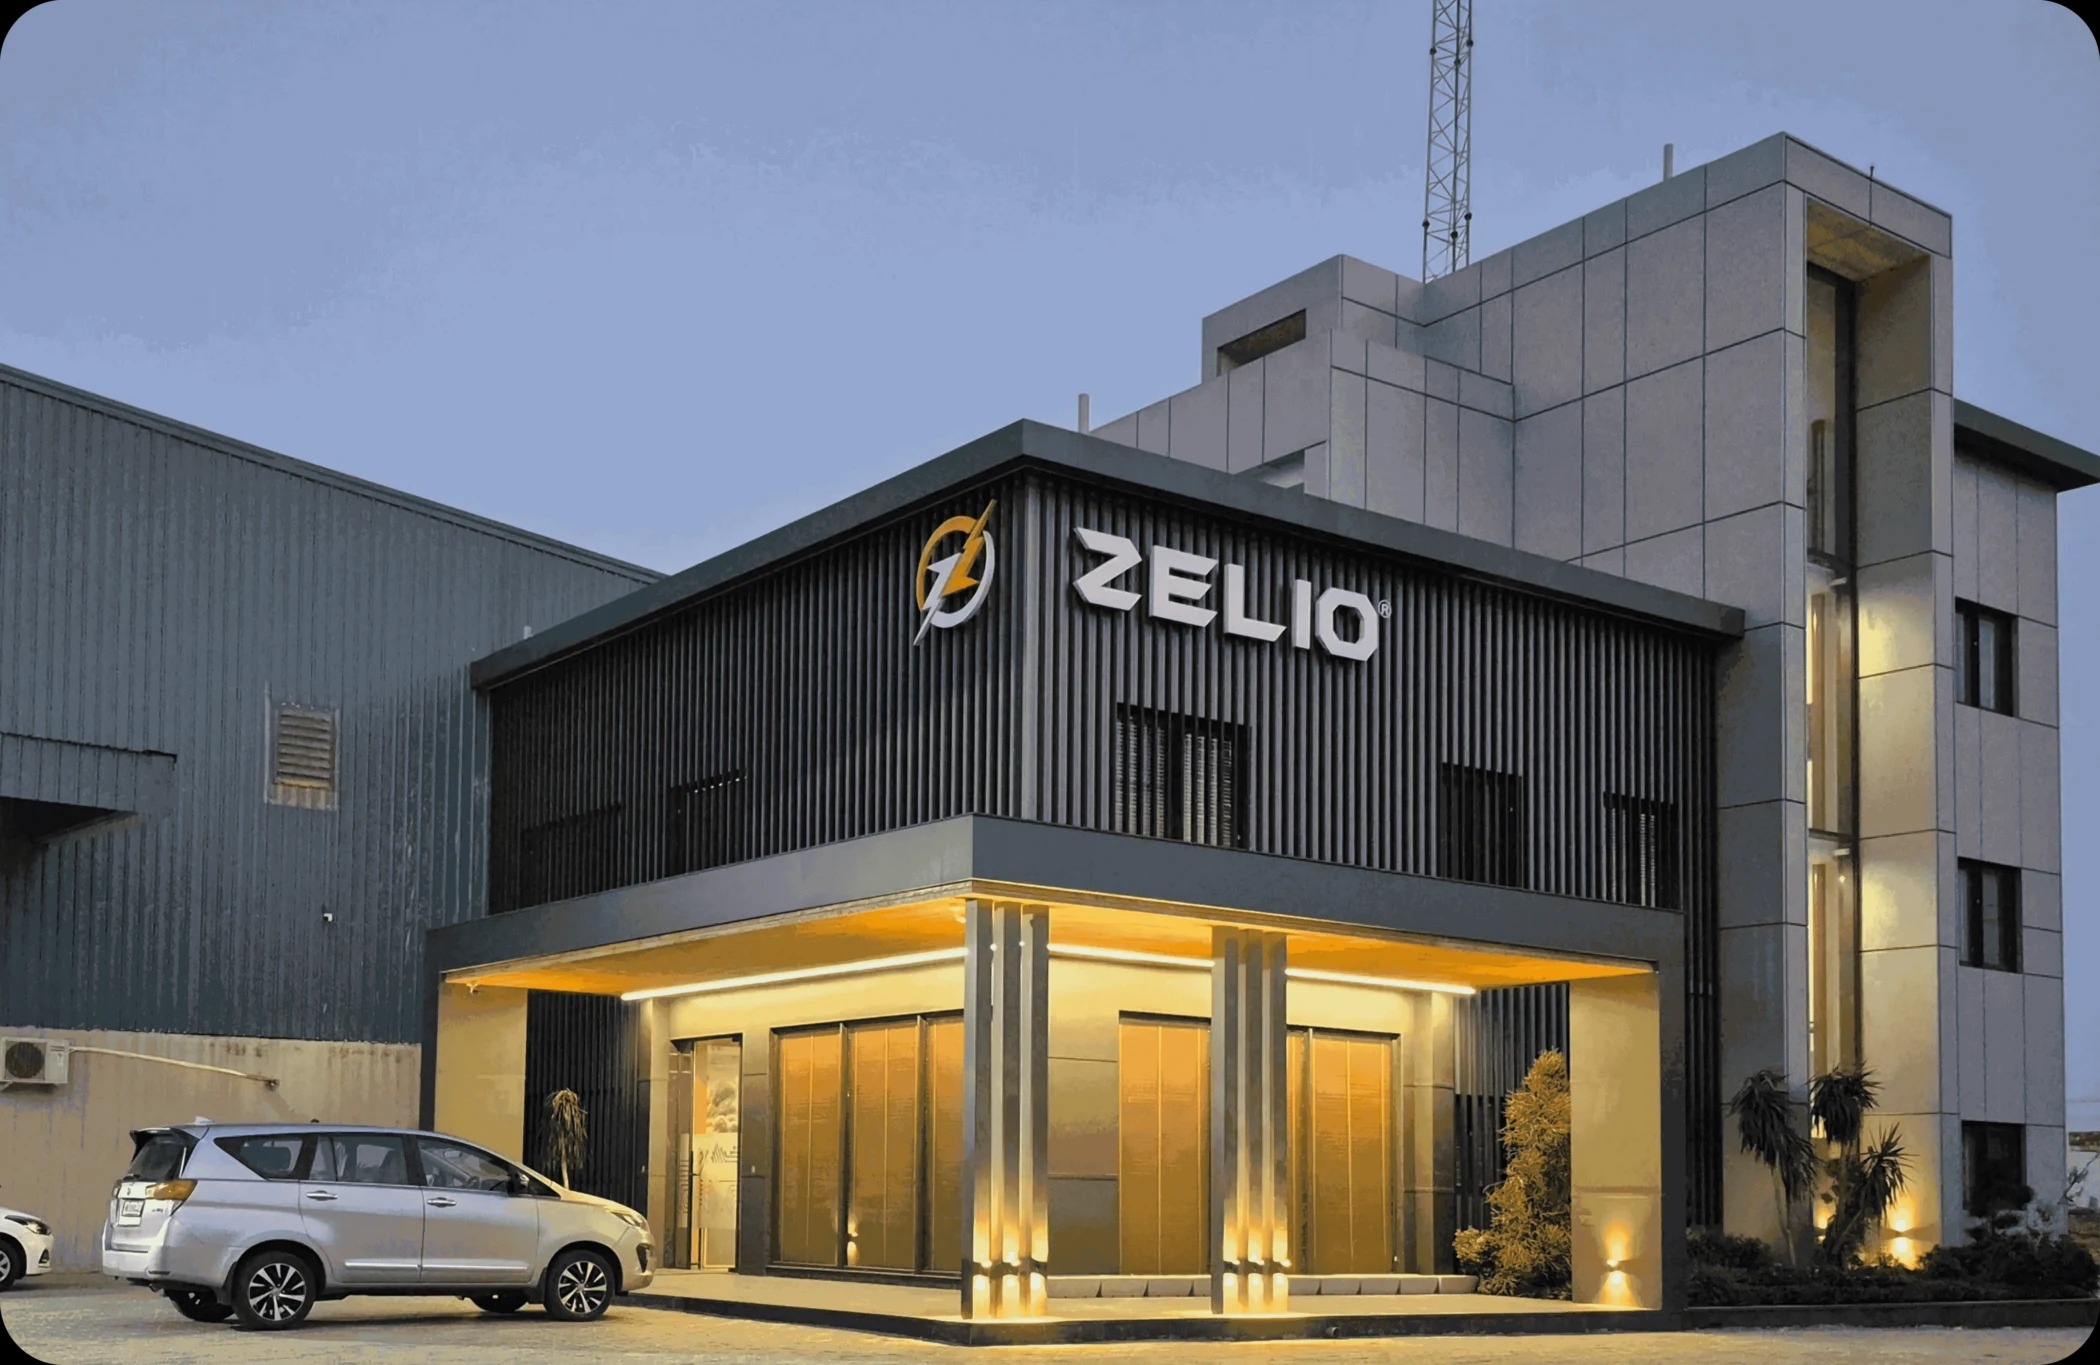
Zelio assembles electric two- and three-wheelers from imported and domestically sourced components, then distributes through 400+ dealers (targeted to expand to 550+ in FY27).
The two-wheeler product range spans EEVA, EEVAZX, Gracy, Legender, Mystery, and XMen—essentially positioning variants (speed, range, color) into user buckets: students, homemakers, gig workers, and Tier 2 town residents.
The three-wheeler line (Tanga, Tanga e-Loader) remains nascent—800 units sold in FY26, with a ₹2,000+ unit target for FY27.
Revenue mix (FY25): 96.5% from two-wheelers, 2% three-wheelers, 1.5% spares and others. Geographic revenue (FY25): Haryana 26.5%, Uttar Pradesh 12%, Gujarat 10%, West Bengal 10%, Madhya Pradesh 9.5%, Punjab 8.5%, Odisha 5%, Rajasthan 4%, Maharashtra 2%, Jharkhand 2%.
Management’s localization play is ambitious: Zelio Auto Components Ltd (wholly owned subsidiary) now sources “bulk components 100% indigenous” with a goal of 70–80% Make-in-India content across 5–6 models by FY27/FY28. Battery assembly and technical imports remain external.
The dealer network is shifting toward 100% exclusive outlets (currently ~70%). Management cites this as a branding control lever.
The question is distribution depth: Zelio operates in 25+ states but has concentrated northern presence. South India penetration—enabled by the Tamil Nadu plant—is still nascent.
4. Financials Overview
Figures are consolidated, in ₹ crore.
| Metric | FY26 | FY25 YoY | FY24 |
|---|---|---|---|
| Revenue | 303.54 | +77% | 94.20 |
| EBITDA | 38.01 | — | — |
| PAT | 28.03 | +75% | 6.31 |
| EPS (full year) | 13.25 | — | 2.10 |
Concall notes (June 2026 earnings call):
Management asserted “not a single quarter of losses” and “not a single year of EBITDA burn” since inception. EBITDA for FY26 came to ₹38.01 Cr on a 12.2% margin. PAT clocked ₹28.39 Cr (management reported) with a 9.1% net margin, and management claimed PAT has compounded at “~124% CAGR since FY23.”
Operating leverage is cited as the margin driver going forward. Management committed to maintaining profitability without trading it for “vanity volume,” stating this is “the Zelio way.”
No dividend has been paid; the company reinvests all earnings into plant, working capital, and inventory buildup.
5. Market Expectations & Historical Multiples
This section describes how the market is currently pricing the company and how that compares with its own history and peer group. It is descriptive, not predictive.
| Metric | Current | Historical Average | Peer Median |
|---|---|---|---|
| P/E | 42.3x | — | 37.64x |
| EV/EBITDA | 31.5x | — | — |
| P/B | 10.7x | — | — |
| ROE | 40.7% | 53% (3-yr avg) | — |
| ROCE | 38.4% | — | 15.35% |
The market currently pays 42.3x earnings for Zelio, sitting above the two-wheeler/three-wheeler peer median of 37.64x. The stock trades at 10.7x book value against peers like Bajaj Auto (25.8x P/E, 28.2% ROCE) and Eicher Motors (37.6x P/E, 30.5% ROCE), yet Zelio’s ROCE of 38.4% exceeds both.
EV/EBITDA sits at 31.5x, a high multiple reflecting the market’s confidence in the company’s near-term margin expansion narrative.
The 3-year average ROE of 53% suggests the company has sustained high-return operations since FY24, though this was from a small earnings base in that year.
What the market appears to be pricing in: rapid scale-up in a high-growth segment, margin expansion as capacity utilization rises, geographic diversification (four plants operational or commissioned), and the assumption that the low-speed two-wheeler segment itself will sustain 20–25% growth. The multiple also embeds some IPO momentum.
The P/E premium to peers and the EV/EBITDA stretch suggest execution risk is being discounted lightly.
6. What’s Cooking
New plants commissioned at pace: Odisha (60,000 annual units) began filing GST in December 2025 and went live in February 2026. Tamil Nadu facility (~60,000 units) and the Haryana three-wheeler dedicated plant (Patan) both commissioned in July 2026. Total installed capacity jumped from 72,000 to 240,000 units annually in FY26 alone.
FY27 unit target: 125,000+ two-wheelers, 2,000+ three-wheelers. Management called this “the central near-term scaling milestone” in the June 2026 concall. Dealer network to expand from 400+ to 550+.
High-speed EV two-wheelers launching in FY27: Management plans “two high-speed models” while keeping low-speed as “the backbone.” Bikes remain off the roadmap due to battery cost economics—management tied viability to future subsidy support.
IPL partnership (Punjab Kings) for brand visibility. First match aired March 31, 2026; costs were treated as prepaid in FY26, with proportionate recognition in FY27 (~₹1–2 Cr incremental marketing spend guidance for FY27).
Zelio Auto Components subsidiary now contributing positively to consolidated revenue and profitability. Advances to suppliers stand at ₹22.5 Cr (for cost economies); GST/Customs refunds are ₹19 Cr (inverted tax rate).
Tax rate durability: Claimed 115BAB exemption (17% rate) valid for 10 years from FY21—approximately 5 years remaining utility.
7. Balance Sheet
| Item | FY24 | FY25 | FY26 |
|---|---|---|---|
| Total Assets | 29.07 | 65.79 | 152.85 |
| Equity Capital | 0.03 | 16.53 | 21.15 |
| Reserves | 10.64 | 10.14 | 90.02 |
| Borrowings | 14.10 | 30.68 | 18.60 |
| Other Liabilities | 4.30 | 8.44 | 23.08 |
| Total Liabilities | 29.07 | 65.79 | 152.85 |
Balance sheet reconciliation: Total Assets = Total Liabilities across all years. ✓
Three observations:
The equity base doubled from ₹16.53 Cr (FY25) to ₹21.15 Cr (FY26) through the October 2025 IPO capital infusion. Reserves jumped ₹80 Cr in one year—the consequence of FY26 profits and IPO proceeds hitting the books. Debt actually fell from ₹30.68 Cr (FY25) to ₹18.60 Cr (FY26), signaling debt repayment from IPO capital. The debt-to-equity ratio stands at 0.18x, positioned as “substantial firepower.”
Other liabilities ballooned from ₹8.44 Cr to ₹23.08 Cr, likely reflecting supplier payables and accruals tied to rapid working capital buildup for inventory and plant-related purchases.
Cash & Bank jumped from ₹0.32 Cr (FY25) to ₹26 Cr (FY26), a ₹25.69 Cr net cash inflow from the IPO and net financing activity.
One wisdom line: A balance sheet stocked with IPO capital and declining debt—the company has runway, but only if the four plants can fill to 60–85% utilization within 12–18 months.
8. Cash Flow: Sab Number Game Hai
| Period | Operating | Investing | Financing |
|---|---|---|---|
| FY24 | 1.12 | -4.64 | 3.47 |
| FY25 | -9.57 | -4.86 | 14.69 |
| FY26 | -7.39 | -9.30 | 42.37 |
Operating cash is in the red: −₹7.39 Cr in FY26. The driver is working capital bloat—inventory days stayed flat at 87 (FY25: 87 days), receivables collapsed to 3 days (from 10), but payables stretched to 24 days (from 9). The net effect is a cash conversion cycle of 66 days, up from 88 days prior year.
Investing cash is negative every year as the company plows money into fixed assets: plant, machinery, CWIP. FY26 saw −₹9.30 Cr (up from −₹4.86 Cr), reflecting the four-plant build-out.
Financing cash swung massively positive at ₹42.37 Cr (FY26), almost entirely from IPO proceeds of ₹62.84 Cr net. Debt repayment and interest paid came out of this.
Net cash flow positive at ₹25.69 Cr (from ₹0.26 Cr prior year) masks the underlying operational stress: the company is cash-negative before financing. Free cash flow (operating minus investing) sits at −₹16.69 Cr (−7.39 − 9.30).
One wisdom line: The IPO plugged the hole. Once that capital is spent on plants, the question becomes whether revenue and margins can sustainably turn operating cash positive.
9. Ratios: Sexy or Stressy?
| Ratio | Value |
|---|---|
| ROE | 40.7% |
| ROCE | 38.4% |
| P/E | 42.3x |
| PAT Margin | 9.2% |
| D/E | 0.18x |
The equity is earning 40.7% annually on its capital deployed—a high multiple suggesting either exceptional operations or a small earnings base being leveraged. The 3-year ROE average of 53% sits even higher, though this is from progressively rising profit on a low base.
ROCE of 38.4% suggests the total capital employed (debt + equity) is turning over efficiently. This exceeds the cost of capital substantially, so the company is value-creating in the abstract—provided the next phase of capex scales revenue proportionately.
The P/E at 42.3x is the ratio asking the hard question: does a 40% ROE justify a 42x earnings multiple when the business is barely four years into scaled profitability and has negative operating cash? The metric reveals confidence, not risk-reward clarity.
PAT margin at 9.2% is thin and offers little room for pricing pressure or demand disruption. Gross margins (implied from COGS) run at 23% (1 − [232.54 / 303.54]), which is reasonable for assembled EVs but vulnerable to battery cost inflation.
Debt-to-equity of 0.18x is prudent, leaving headroom for future leverage if capex ramps further.
10. P&L Breakdown: Show Me the Money
| Fiscal Year | Revenue | EBITDA | PAT |
|---|---|---|---|
| FY24 | 94.20 | 9.42 | 6.31 |
| FY25 | 171.97 | 20.70 | 16.01 |
| FY26 | 303.54 | 38.01 | 28.03 |
Revenue more than tripled from FY24 to FY26. EBITDA scaled proportionately (10% margin in FY24, 12% in FY26), suggesting the business has captured some operating leverage as production accelerated. PAT compounded at ~124% since FY23 (per management), a trajectory powered by volume and a steady ~17% tax rate.
The underlying narrative: rapid capacity scaling paired with dealer channel expansion has driven revenue growth that outruns cost growth. Depreciation stayed flat at ~₹1.4–1.5 Cr despite capex, implying that most plant capex is being capitalized rather than hitting the P&L as depreciation yet. This is typical during a build-out phase but will reverse when the new plants are fully depreciated.
11. Peer Comparison
| Company | Revenue | PAT | P/E |
|---|---|---|---|
| Bajaj Auto | 17,832 | 3,492 | 25.8x |
| Eicher Motors | 6,080 | 1,520 | 37.6x |
| TVS Motor | 15,053 | 820 | 53.8x |
| Hero MotoCorp | 12,978 | 1,474 | 17.2x |
| Zelio E-Mobility | 170 (Qtr, annualized ~680) | 16.21 (Qtr, annualized ~65) | 42.3x |
Zelio’s quarterly revenue of ₹170 Cr annualizes to ~₹680 Cr run-rate, placing it well below the incumbent two/three-wheeler majors. Bajaj’s quarterly profit of ₹3,492 Cr dwarfs Zelio’s ₹16.21 Cr—a 215x difference. Eicher and TVS are 100x+ larger in profit.
Zelio’s P/E of 42.3x sits above Bajaj (25.8x) and below Eicher (37.6x), which might suggest valuation neutrality. However, Bajaj and Hero MotoCorp sport 28–36% ROCE, while TVS lags at 17.4%. Zelio’s 38.4% ROCE is the highest in the set, a fact the market is pricing in but at the risk of execution miss.
The gap is size and profitability stability. Bajaj and Hero have 80+ years of consistent earnings. Zelio has three years. The multiple compresses the moment growth slows.
12. Miscellaneous: Shareholding & Promoters
| Holder | % |
|---|---|
| Promoters | 72.77% |
| FIIs | 0.09% |
| DIIs | 2.13% |
| Public | 25.01% |
Three promoters control the business: Deepak Arya, Niraj Arya, and Kunal Arya (each 24.25% as of March 2026). All three are co-founders and repeat the holding across corporate actions. A fourth founder, Saroj Arya, holds 0%.
The promoter holding has stayed rock-solid at 72.77%, signaling no dilution or exit plans post-IPO. Zero pledges (as reported), which removes a classic red flag.
FII interest collapsed from 3.42% (September 2025, right at IPO) to 0.09% (March 2026)—a near-complete unwind in six months. This is not uncommon for SME IPOs and may suggest limited institutional conviction or portfolio rebalancing. DIIs also halved from 10.89% to 2.13%, leaving retail (public) holding at 25.01% post-IPO.
Management claimed “zero investor complaints” and “zero audit qualifications” for FY23–FY26. The company is BSE SME-listed (exempting it from certain corporate governance audits under SME rules).
13. Corporate Governance: Angels or Devils?
The company benefits from BSE SME listing exemptions, meaning formal corporate governance audits do not apply. Annual Secretarial Compliance reports were not filed for FY26 (noted in May 2026 filing).
Auditors have issued zero qualifications across four years (per management), a claim that removes one governance friction.
Related-party transactions are minimal and disclosed. The subsidiary (Zelio Auto Components) is wholly owned and consolidates into financials.
No tax demands have been publicly announced. The 115BAB exemption (17% rate, valid ~5 more years) is contingent on continued compliance with profit/revenue thresholds—management did not detail the specific thresholds or risks of exemption withdrawal.
Divyanshu Agarwal was appointed CEO in April 2026, replacing the founding structure. Agarwal comes from Navi (fintech background), bringing operational discipline but potentially a different cultural lens than the founders.
No material related-party loans, pledges, or complex structures have been flagged. The balance sheet is straightforward.
14. Industry Roast & Macro Context
The low-speed EV two-wheeler segment is characterized as an “8–10 lakh units per year” category growing at 20–25% CAGR—a structural advantage over the headline-driven high-speed segment, which faces heavy subsidies, licensing, and registration overhead.
The segment’s addressees are cost-conscious: students, homemakers, gig workers, and Tier 2/3 town residents. Price band: ₹50–75k, with no mandatory insurance, registration, or license. This removes friction for first-time EV buyers in rural and semi-urban India.
Battery costs remain the sector’s fulcrum. Zelio does not manufacture cells or packs; it sources and assembles them domestically and from imports. A 20% drop in battery ASP (average selling price) would collapse margins industry-wide. Management sidestepped bikes because battery-to-ASP math doesn’t work yet—a candid acknowledgment.
Competition is emerging: Ather Energy and Ola Electric are chasing the high-speed market and will eventually trickle down into low-speed if economics allow. Both are generating negative ROCE currently (Ather at −19.77%, Ola at −19.56%), signaling the sector’s pricing wars and scale-chasing phase.
Monsoonal and rural income volatility can dent demand. Management downplayed this, claiming monsoon effects don’t materially hit annual volumes (a claim without audited evidence).
Government support currently does not accrue directly to Zelio—subsidy schemes remain minimal. The structural advantage is regulatory (no registration requirement), not financial.
15. EduInvesting Verdict
| Aspect | Detail |
|---|---|
| Strengths | 75% profit CAGR over 3 years; 40%+ ROE/ROCE; four plants operational; positive net cash post-IPO; zero debt pledges; “no losses, no EBITDA burn” (management’s claim) |
| Weaknesses | Negative operating cash; inventory and payables surging; thin 9% PAT margin; only 3 years into scale-up; FII/DII unwind post-IPO; no dividend coverage |
| Opportunities | 125k+ unit FY27 target; South India (new plants); high-speed models; dealer network expansion from 400 to 550+; Tier 2/3 geographic penetration |
| Threats | Battery cost inflation; competitive intensity from Ather/Ola; execution risk on four-plant ramp; working capital melt; demand softness if rural income slips; low-speed segment’s ultimate addressability unproven at scale |
Closing observation:
A balance sheet with fresh IPO capital and nearly a decade of unbroken profitability sits against a multiple that is pricing the company as if four-plant utilization, 125k unit volume, and sustained 75% growth are all but locked in. The underlying truth—that Zelio has scaled from ₹13 Cr (FY22) to ₹304 Cr (FY26)—is not in question. What is: whether a 42.3x P/E buys enough margin of error to absorb even modest execution delays or demand softness in the low-speed EV cycle.
