Search for Stocks /

Wanbury Ltd FY26: Turnaround in Progress, Leverage Still Unpaid

Spotted a factual error — a wrong number, date, or fact? Tell us and we will check the source.

General information and entertainment, not investment advice. The author is not a SEBI-registered adviser or research analyst. No recommendation, no promised returns. Markets carry risk including loss of capital. Figures may not be current. Consult a registered adviser before acting.


1. At a Glance

Wanbury posted FY26 revenue of ₹650 Cr, up 8.5% YoY, with net profit jumping to ₹66 Cr from ₹31 Cr—a swing powered by margin recovery, cost discipline, and favourable tax write-backs. Yet the balance sheet still carries ₹224 Cr in debt against ₹110 Cr in reserves, a leverage story that hasn’t fully resolved. The company manufactures active pharmaceutical ingredients (APIs) in regulated export markets, where it holds 11% of global Metformin and 30% of global Sertraline capacity.

Metformin and Sertraline together account for 85–90% of API revenue—high concentration, and commoditised Metformin is vulnerable to input-cost whips. New product launches are underway: four molecules in FY27 promise ₹60–70 Cr of incremental annual revenue. The market pays 13.8x this year’s earnings; the 5-year average sits at 26.7x.

A company pulling out of structural distress, managing capex prudently, but saddled with medium-term debt servicing. The numerics say turnaround; the balance sheet says “not yet.”


2. Introduction

Wanbury was incorporated in 1988 and has spent the last four decades threading the needle between global APIs and domestic formulations. For much of the 2010s and early 2020s, it stumbled: leveraged acquisitions in Spain, price erosion in regulated Europe, and high-cost borrowings left it with negative net worth by FY23 (₹–183 Cr in reserves).

By FY25, a reset began. The company monetised non-core assets, raised equity and structured NCDs, and settled expensive bank debt. In February 2025, it refinanced ₹200 Cr of NCDs at 12.5%, locking in lower carry costs going forward. Infomerics upgraded its rating to IVR BBB-/Stable in March 2026, removing the issuer from non-cooperation status. The company now exports to 50+ countries, operates two USFDA-approved plants, and has started filing for approvals in regulated markets—the US, EU, Latin America, South Korea—where margins hold better and customer stickiness is real.


3. Business Model: WTF Do They Even Do?

Wanbury is 88% API, 12% formulations by revenue. The API side is a global shop: it manufactures Active Pharmaceutical Ingredients—the chemical bulk drugs that generic drugmakers buy to turn into pills.

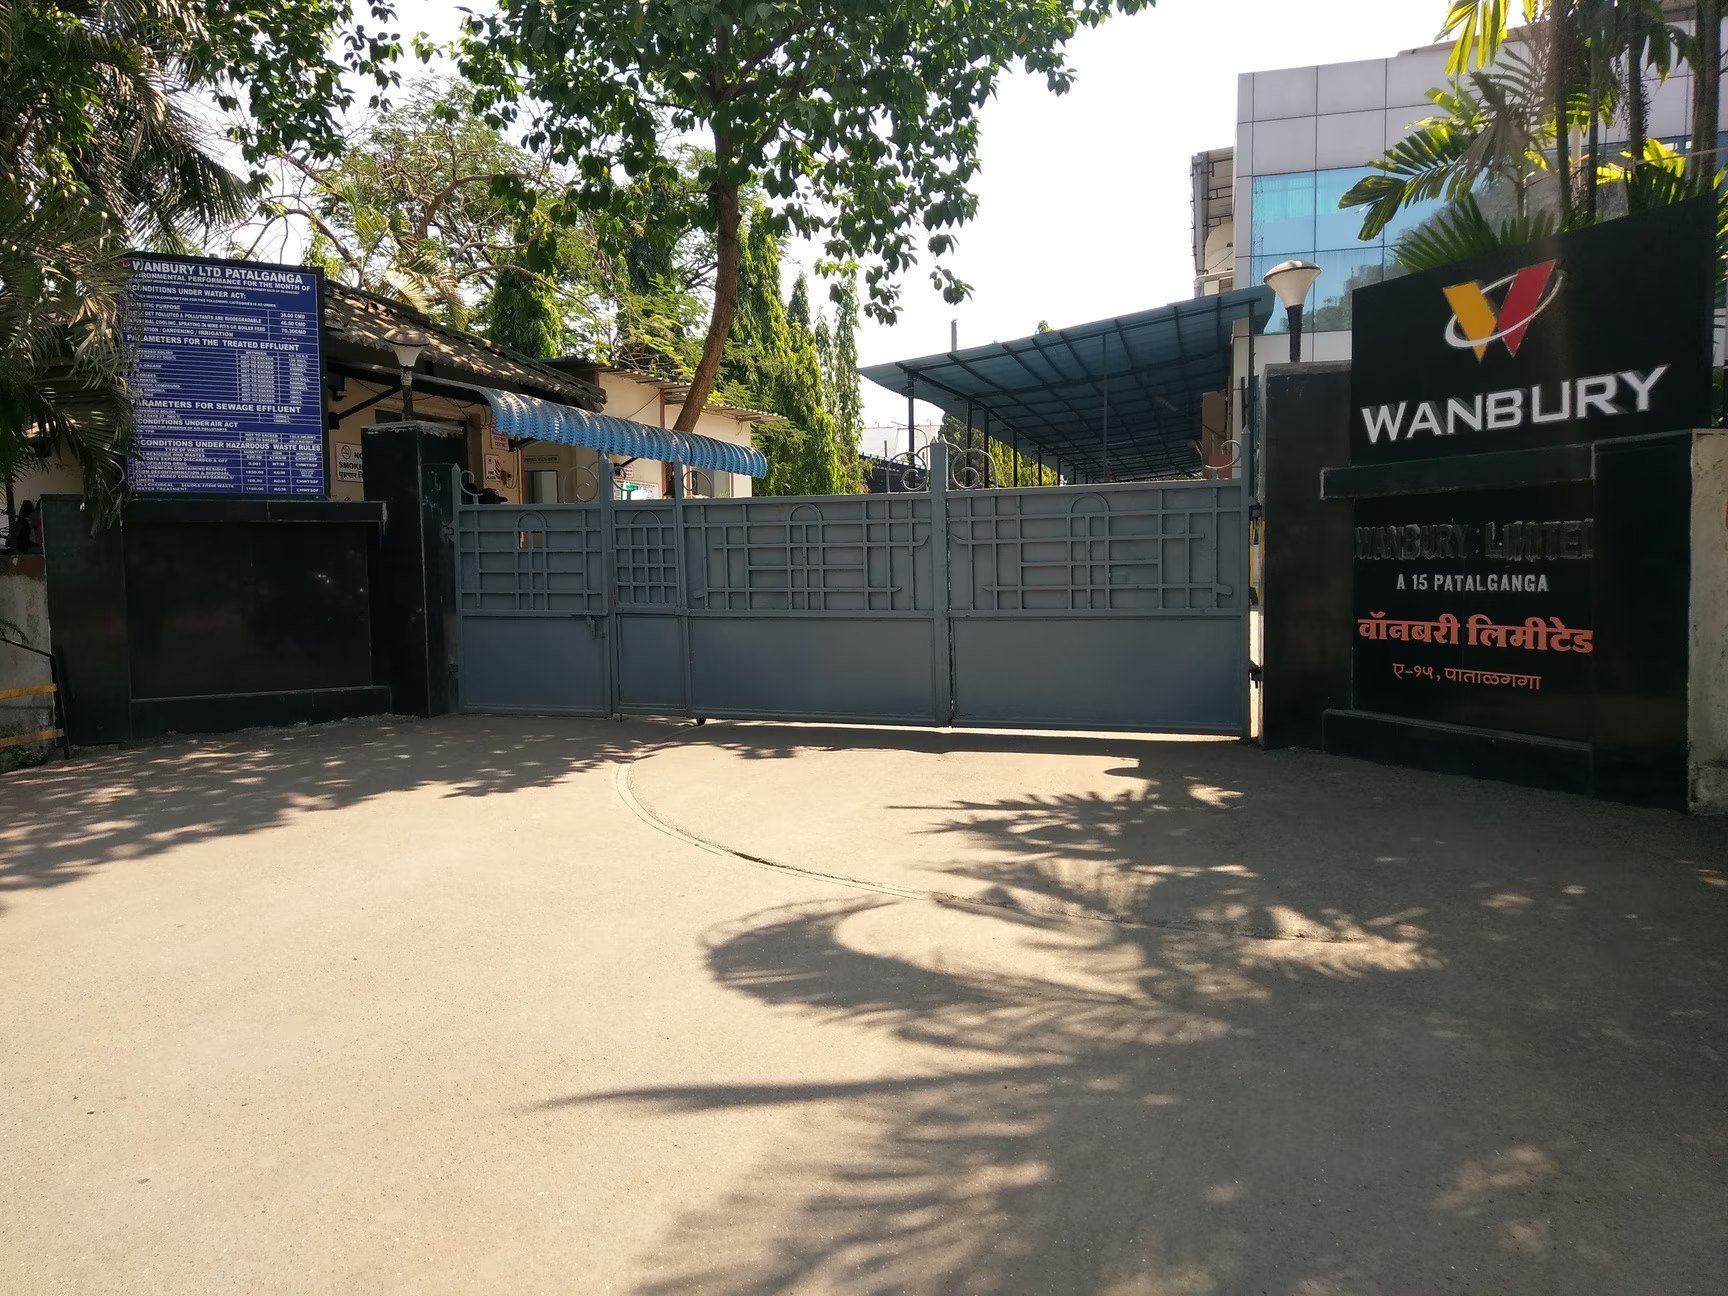
Two plants: Tanuku (Andhra Pradesh) runs 400 KL of reactor capacity and makes Metformin, Sertraline, Tramadol, Paroxetine, Mefenamic Acid, Diphenhydramine, plus a new anaesthetic API. Patalganga (Maharashtra) runs 96 KL and focuses on Metformin and its modified-release variant.

Revenue splits: Metformin ~50%, Sertraline ~40%, Tramadol, Diphenhydramine, and niche actives ~10%. Exports are ~70% of the top line, most bound for regulated markets (Europe, Latin America, South Korea) where pricing discipline beats the Indian generic wars.

The formulation business is a pan-India ethical shop with 70 brands: Clavcure, Rabiplus, Coriminic, Nock, Zeva, etc.—gynaecology, orthopedics, antibiotics, cough & cold, neutraceuticals. Small, steady, domestic cash generator. It’s not the growth engine, but it pays bills and keeps field forces busy.

The moat: global market share in niche APIs. Metformin is commoditised (huge capacity, many players), so margins are thin; Sertraline is tighter (30% of global capacity), so pricing power exists. The formulation business is a moat-free zone—it’s just another pan-India ethical box, crowded and low-margin. Management has been smart to let APIs lead.


4. Financials Overview

Figures are consolidated, in ₹ crore.

MetricFY26 AuditedFY25 AuditedYoY Change
Revenue650.3599.5+8.5%
EBITDA106.776.3+39.8%
PAT66.130.5+116.6%
EPS (₹)18.939.28+104.0%

Quarterly (Q4 FY26): Sales ₹164.6 Cr (–4.3% QoQ, normalising after exceptional Q3 strength), Net Profit ₹21.7 Cr (+24.1% YoY), EPS ₹6.21 (not annualised).

The story: Revenues grew 8.5%, but margins surged. EBITDA jumped 40%, driven by three tailwinds: (a) process efficiencies (E&Y benchmarking, improved input–output ratios), (b) plant debottlenecking without major capex (10–15% capacity uplift), (c) solvent recovery yielding higher batch yields. PAT near-doubled, but carry unusual tax items: a ₹360 Cr exceptional charge (₹3.6 Cr in gross terms) for gratuity/leave liability under the new Labour Codes, offset by a ₹551.67 Cr deferred-tax write-off (₹5.5 Cr in net terms) due to transition to the concessional income-tax regime effective April 2026. Strip those, and the core operating earnings rose about 50%.

Operating profit rose from ₹76.3 Cr (FY25) to ₹107 Cr (FY26), a 40% gain. Interest expense fell from ₹37 Cr (FY25) to ₹30 Cr (FY26), thanks to refinancing of expensive ARC debt with cheaper NCDs. The company’s average cost of borrowing has declined.

One caution: debtor days at 80 are sticky (2-month average), inventory 67 days. Working capital is a drag that the company is managing but not curing. Free cash flow for FY26 was negative ₹28 Cr (investing activity ₹56 Cr, mostly capex).


5. Market Expectations & Historical Multiples

This section describes how the market is currently pricing the company and how that compares with its own history and peer group. It is descriptive, not predictive.

MetricCurrent5-Year AveragePeer Median
P/E13.826.732.2
EV/EBITDA10.9
ROE68.4%12.5%
ROCE30.8%15.1%

The market currently pays 13.8x earnings here, against a peer median of 32.2x and its own 5-year average of 26.7x. The variance is large: peers are expensive, history is expensive, this is not.

The multiple sits below both peer group and the company’s own history, suggesting the market is pricing in either recovery doubt or leverage risk. The company’s ROE stands at 68.4% (FY26), well above peer median of 12.5%, and ROCE at 30.8% beats the median 15.1%—returns have snapped back sharply as profitability recovered and capital base stabilised.
One factual observation: the market appears to be waiting to see if the company can sustain this margin and cash generation while servicing ₹224 Cr of debt due out over three years. Until leverage moves materially, the P/E discount may persist.


6. What’s Cooking

New Product Pipeline (Q4 FY26 → FY27): The company has launched an anaesthetic API in Q4 FY26 and plans four new molecules in FY27 (including Dextromethorphan HBr and Ketamine HCl) and another four in FY28 (Rivaroxaban, Sitagliptin, and others). Expected contribution: ₹60–70 Cr annual incremental revenue, or 7–9% growth p.a.

Regulatory Wins: MFDS (Korea) GMP audit at Patalganga cleared with zero observations (April 2026). TGA inspection at Tanuku completed (June 2026); GMP certificate may unlock 3 additional API shipments. Brazil ANVISA approvals in place. DMF filings for Diphenhydramine HCl and Paroxetine HCl completed. These are commercial hinges, not rubber-stamp approvals.

Capex Execution: FY26 capex was ₹56 Cr (equipment ₹12 Cr, debottlenecking ₹14 Cr, new capacity ₹38 Cr). FY27 planned at ₹63 Cr (infrastructure ₹12 Cr, new production block ₹45 Cr, storage ₹6 Cr). Internally funded, no incremental term debt.

NCD Refinancing: February 2025 issuance of ₹200 Cr at 12.5% coupon. Repayment commences Q4 FY26 (₹10 Cr), then ₹40 Cr annually through Feb 2030.

Debt Reduction: The company has repaid ₹52.82 Cr of Edelweiss ARC term loans and ₹4–5 Cr of bank facilities, concentrating debt into cheaper NCDs.


7. Balance Sheet

ItemFY26FY25FY24
Total Assets517.7413.9343.1
Equity Capital35.032.832.8
Reserves109.526.5–4.8
Total Equity144.559.328.0
Borrowings224.4178.8115.8
Other Liabilities148.9175.8199.4
Total Liabilities517.7413.9343.1

Assets = Liabilities, balanced across all columns.

Three observations:

(a) Reserves went from ₹–5 Cr (FY24) to ₹110 Cr (FY26). This is a ₹115 Cr swing in two years—a real reset. The company stopped burning through equity and started building it back. The pace is slow, but the direction is right. PAT of ₹66 Cr in FY26 vs interest ₹30 Cr means the company is earning real cash. That cash either retains in reserves or goes to debt paydown, not dividends (0% payout ratio since inception).

(b) Borrowings rose to ₹224 Cr from ₹179 Cr (FY25) and ₹116 Cr (FY24). This looks bad at first glance, but it’s a refinancing story, not a spiral. The company swapped ₹200 Cr of high-cost ARC debt (18–20% IRR) for ₹200 Cr NCDs at 12.5%, lowering annual carry by ₹10–15 Cr. The absolute debt level is stable; the mix improved. Over FY26–28, the company plans to deleverage using operating cash flows.

(c) Net Worth is ₹144.5 Cr (FY26) vs ₹59.3 Cr (FY25). D/E ratio fell to 1.55x from 3.02x. Leverage is still elevated, but the trajectory is clear. At GCA of ₹80–120 Cr p.a. (management guidance) and NCD repayments of ₹40 Cr p.a., the company should have positive FCF to attack debt.

Net cash position: Cash ₹7.6 Cr + short-term investments ₹7.6 Cr, less debt ₹224 Cr = net debt ₹209 Cr. Stated as: the company carries net debt of ₹209 Cr against a ₹144.5 Cr equity base. The leverage math isn’t yet comfortable, but it’s moving.


8. Cash Flow: Sab Number Game Hai

YearOperatingInvestingFinancing
FY244.7–16.613.9
FY2526.1–51.225.7
FY2631.5–56.422.4

Operating cash flow rose to ₹31.5 Cr (FY26) from ₹26.1 Cr (FY25), up 21%. This is the money the business generates before capex and financing: it’s real, it’s growing, but it’s not sky-high in absolute terms. Working capital absorption (debtors and inventory buildout) is real; the company is managing it but not reversing it yet.

Investing cash outflow of ₹56.4 Cr is capex plus miscellaneous items. The company is building capacity for new products and maintaining existing plants. FY27 guidance is ₹63 Cr capex, so this pace will hold.

Financing cash of ₹22.4 Cr includes NCD repayment (₹10 Cr in Q4 + the rest in quarterly tranches) and refinancing. This will accelerate to ₹40 Cr p.a. from FY27.

Free cash flow (Operating – Investing) = ₹31.5 – ₹56.4 = –₹24.9 Cr in FY26. The company is capex-heavy and cash-poor on a FCF basis. But (a) capex is concentrated for new products and will taper post-FY27, and (b) management guidance assumes GCA of ₹80–120 Cr p.a. in the medium term, which would flip FCF positive once capex normalises. That’s a medium-term bet, not a done deal.

The key thread: operating cash is real and growing, but capex is front-loaded.


9. Ratios: Sexy or Stressy?

RatioValueImplication
ROE68.4%Returns on equity have surged as profitability recovered and the reserve base stabilised.
ROCE30.8%Capital returns are well above the cost of capital (12.5% NCD rate), signalling efficient deployment.
P/E13.8The market prices this at a historical discount, below its 5-yr average and well below peers.
PAT Margin10.2%Operating margins have recovered sharply (from 5% in FY23 to 10%+ now), indicating structural improvement in plant efficiency.
D/E1.55Leverage remains elevated but has improved materially. The prior d/e was 3.0x; refinancing is working.

ROE 68.4%—the equity is earning hard. This is inflated by the small reserve base (₹110 Cr), so you’re dividing a growing profit by low capital. As reserves grow, ROE will normalise downward. But the underlying business is now generating real returns.

ROCE 30.8%—the capital is working. At a weighted-average cost of capital of ~10–11% (blending ₹224 Cr of 12.5% debt with equity returning 68%), the company is creating value on a blended basis.

P/E 13.8—the market is not celebrating. The discount to history and peers is real. Execution risk on new products, debt servicing, and leverage trajectory all weigh on the multiple.

PAT margin 10.2%—the plant has found its feet. From negative and low margins in FY18–23, the company has systematically climbed back. E&Y benchmarking, solvent recovery, higher yields, and direct procurement from overseas suppliers have all lifted the operating leverage line.

D/E 1.55—still high, but better. Two-thirds of the company is financed by debt in absolute terms. Medium-term deleverage is the key covenant: if GCA reaches ₹100 Cr p.a. and debt repayment is ₹40 Cr p.a., net debt should fall to ₹160 Cr by FY28, bringing D/E closer to 1.1–1.2x.


10. P&L Breakdown: Show Me the Money

YearRevenueEBITDAPAT
FY24577.772.130.4
FY25599.576.330.5
FY26650.3106.766.1

Revenue trajectory: After flat years (FY24–25 growth of 3.7%), FY26 jumped 8.5% to ₹650 Cr. This is driven by (a) base-effect recovery from FY23–24 distress, (b) modest volume growth in Metformin and Sertraline, and (c) new product ramps into Brazil (Sertraline Form II approved in March 2026, holding 75% of the Brazilian market for this molecule).

EBITDA trajectory: The inflection is sharp. From ₹72 Cr (FY24), it scaled to ₹77 Cr (FY25), then ₹107 Cr (FY26)—a 48% jump in one year. This is where the turnaround lives: margins expanded 40 bps from FY25 (12.7%) to FY26 (16.4%). Operating leverage is real.

PAT trajectory: From ₹30 Cr (FY24–25 range), it vaulted to ₹66 Cr (FY26)—more than double. But this includes the tax write-back (₹5.5 Cr net benefit) and exceptional charge (₹3.6 Cr cost). Core PAT would be ~₹64 Cr. Still a doubling from FY25’s ₹30.5 Cr. The business turned.


11. Peer Comparison

CompanyRevenuePATP/E
Sun Pharma.58,46212,47734.8
Divi’s Lab.10,5602,62367.2
Torrent Pharma.13,9802,19270.6
Cipla28,1633,80629.5
Zydus Lifesci.27,1485,42620.5
Dr Reddy’s33,7004,19625.4
Lupin27,9585,76518.2
Wanbury6507013.8
Peer Median1,7494232.2

Wanbury is a dwarf in a room of giants. At ₹650 Cr revenue, it’s 2–3% the size of Cipla or Lupin and <2% the size of Sun Pharma. Yet its P/E of 13.8 sits below the peer median of 32.2, and well below Divi’s (67x), Torrent (70x), and Cipla (29.5x). On a scale basis, it’s illiquid; on multiples, it’s cheap relative to the set.

ROE and ROCE are outliers to the upside (68.4% and 30.8% vs. peer median ROE of 12.5%, ROCE of 15.1%), a function of Wanbury’s low capital base and high recent profitability. As it scales, returns will normalise downward. PAT margin is 10.2% vs. peer median 16.7%—Wanbury is still lower-margin, reflecting its API-heavy mix (commoditised Metformin) and formulation base.

The story in comparative terms: Wanbury is a micro-cap with concentrated products, better recent execution, and worse historical economics than peers. The multiple discount makes sense until margins and scale prove sustainable.


12. Miscellaneous: Shareholding & Promoters

Holder%
Promoters43.0
FIIs0.6
Institutions (DII)0.0
Public56.4

Promoter holding: 43%, held by Expert Chemicals (India) Pvt Ltd (~34%) and Kingsbury Investments Inc (~9%). The group is led by K. Chandran and Mohan Kumar Rayana, both with 30+ years in pharma and deep operational involvement in the turnaround since FY23. They own what they operate, which is good; they also carry leverage on their holding—pledges stand at 37.1% of total share capital, up from zero in FY23. This is a covenant risk flag: if the stock falls, margin calls could trigger dilution or forced selling.

Institutional & FII: Minimal. This is a non-institutional, retail-heavy stock. No major mutual funds or foreign investors have marked territory. The promoter and retail base is 99.4% of the cap table.

Public holding: 56.4%, fragmented across ~16,700 shareholders. Retail.

Governance red flag: Promoter pledges at 37% are a leverage signal. If the company misses earnings or debt covenants, pledged shares could be invoked. The board appointed Chandran Krishnamoorthy as Whole-time Director (September 2025) and locked in remuneration, a positive signal of stability. No major recent resignations or governance crises.


13. Corporate Governance: Angels or Devils?

Auditors: Kapoor & Parekh Associates (ICAI FRN 104803W) issued unmodified opinions on FY26 financials—no red flags on audit quality.

Board & Management: The current board includes the promoter founders and independent directors. K. Chandran appointed as Whole-time Director for 5 years (Sept 2025–Sept 2030). Kala Agarwal appointed as Secretarial Auditor. These are routine governance moves post-turnaround.

Pledges: 37.1% of total shares pledged as of December 2025. This is significant. Catalyst Trusteeship (a trustee for the promoter group) pledged 6.59 lakh shares on Sept 25 and Nov 27, 2025. If the stock falls sharply or covenants are breached, pledged shares are at risk of invocation. A material downside move could trigger forced selling or dilution. This is a real tail risk, not governance theatre.

Related-party transactions: Not highlighted in the filings. No red flags.

Tax disputes: No major demands reported. The company transitioned to the new lower-tax regime effective April 2026 and took a deferred-tax write-off of ₹5.5 Cr. Compliant move, no controversy.

Rating Action: Infomerics upgraded from C+/Negative (with “issuer not cooperating” label) to BBB-/Stable in March 2026. The upgrade factors in the turnaround and removal from the “not cooperating” bucket. This is a behavioural signal: the company is now transparent and in dialogue with credit agencies.


14. Industry Roast & Macro Context

The API market is split into three castes: branded-generic formulation companies (Cipla, Lupin) competing on price; pure-play API players (Divi’s, Torrent, some of Lupin); and micro-cap API specialists (Wanbury, Celon Labs, Vasudha). The big players make generics and APIs. The specialists make only APIs, betting on scale in niche molecules.

Metformin: The diabetes drug is made by 20+ players globally. India has ~10% of global capacity; China, ~30%. Price is set by the lowest-cost producer, usually China. Wanbury holds 11% of global Metformin capacity—not insignificant, but it’s a commodity. Margins are single-digit on Metformin alone; the company survives on mix and efficiency.

Sertraline: The antidepressant is less commoditised (fewer global players, patent moats in specific formulations). Wanbury holds 30% of global capacity. Better pricing power than Metformin, but still generic economics. Brazil’s ANVISA approval is a win for market access, not pricing.

Regulation: US FDA approvals are hard gates—Wanbury is not yet approved in the US. The company is chasing DMF approvals and is in talks with US customers. Once US entry happens, it opens a larger market with higher margins. But it’s 1–2 years away, not imminent.

China: Raw material sourcing from China is a wild card. The geopolitical cold war and supply-chain de-risking are slowly pushing generics players toward India, but it’s glacial. Wanbury benefits if India becomes a default for APIs, but it’s not a near-term catalyst.

Pricing pressure: Global generic API prices are down 1–3% CAGR for the past decade. Wanbury’s growth is driven by volume (Metformin, Sertraline demand is rising globally as diabetes and depression prevalence climb), not pricing. The company is betting on operational efficiency and new molecules to offset commoditisation.

Distribution: The company sells to 50+ countries via 30 direct customers and a network of 1,800+ distributors. This is a strength: no single customer concentration. A large customer loss wouldn’t crater the business.


15. EduInvesting Verdict

AspectStatus
StrengthsTurnaround in motion: margin recovery from 5% to 16%; restructured debt at lower rates; new product pipeline; export-diversified customer base; 11% of global Metformin, 30% of global Sertraline.
WeaknessesProduct concentration (85–90% from two molecules); elevated leverage (D/E 1.55) with ₹40 Cr annual NCD repayment thru FY30; negative FCF until capex tapers; promoter pledges (37%) create tail risk.
OpportunitiesUS FDA approvals (1–2 yrs out); four new molecules p.a. for next two years (₹60–70 Cr revenue uplift); capex completion in FY27 should free cash for deleveraging; global diabetes prevalence rising (Metformin demand).
ThreatsChina supply-chain dependencies; commoditisation of Metformin; execution risk on new-product launches; if GCA misses guidance, leverage trap; macroeconomic slowdown hitting pharma demand; pledged shares at risk if stock weakens.

The closing observation: A company halfway through a debt restructuring, with a strengthening P&L, but carrying execution risk on leverage paydown and new-product ramps. The balance sheet reads like a patient in recovery: vitals improving, but still on monitors. The market prices it at 13.8x earnings, below history and peers, which is fair—the story requires another 18 months of proof. Until debt falls materially and new products scale, the P/E discount reflects the right scepticism.
