VRL Logistics Ltd FY26: The Asset-Heavy Premium After a Fierce Weight-Loss Regime
Section 1 — At a Glance
VRL Logistics Ltd has wrapped up FY26 by proving that a fierce weight-loss regime can do wonders for the bottom line, even if it leaves the top line looking a bit lean. The company closed the fiscal year with revenue from operations coming in at ₹3,221.11 crore, printing a subtle 1.90% growth over the previous year’s ₹3,160.95 crore. However, the real fireworks happened down under: Net Profit surged by a massive 29.47% YoY to ₹236.83 crore. This dramatic divergence between sluggish revenue growth and powerful earnings velocity highlights an aggressive strategic pivot. Management spent the year systematically identifying and executing a total exit from lower-margin contracts.
VRL Logistics Ltd wrapped up FY26 with revenue from operations coming in at ₹3,221.11 crore (▲ 1.90% YoY) , while its calculated EBITDA reached ₹650.15 crore (▲ 12.57% YoY) driven by a successful exit from lower-margin contracts. Down at the bottom line, Net Profit surged to ₹236.83 crore (▲ 29.47% YoY) , pushing the finalized full-year Earnings Per Share (EPS) to ₹13.54 (▲ 29.45% YoY).
The core Less-Than-Truckload (LTL) engine now contributes 89.5% of the total revenue pie, completely dominating the operational mix. While this restructuring triggered a temporary 7% drop in full-year cargo tonnage, the fourth quarter marked a vital turning point, with tonnage rebounding into positive territory at 3% YoY expansion.
Investors are closely tracking VRL’s capacity to squeeze structural efficiencies out of its massive ecosystem, though the heavy capital requirements of its fully-owned asset model continue to raise eyebrows in a volatile diesel market. Volatility is the ultimate sanity test for operational efficiency; only those who own their framework can alter their trajectory in mid-air. VRL is positioning itself to capture organized market share, setting the stage for a compelling operational narrative in FY27.
Section 2 — Introduction
VRL Logistics stands out as a unique titan in India’s heavily fragmented transportation architecture. Unlike asset-light aggregators that rely entirely on third-party fleets and localized brokers, VRL operates on a deeply rooted, asset-heavy philosophy. The company commands an immense, tightly controlled infrastructure that makes it an absolute market leader in the domestic B2B parcel arena.
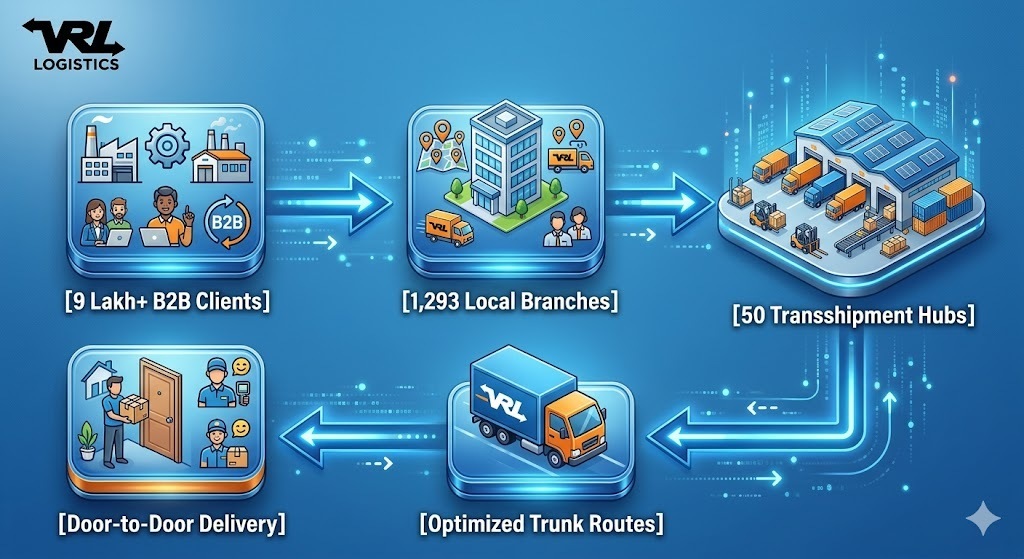
The purpose of analyzing VRL right now is simple: the organization has successfully completed a massive corporate clean-up. By systematically hiving off its legacy, non-core operations—including passenger bus travel, wind energy projects, and air charter units—VRL has transformed itself into a pure-play goods transportation business. It enters its 50th year of service with streamlined corporate focus, an expanded network of 1,293 branches, and fresh credit rating upgrades. This analysis dissects whether its newly refined margin profile can comfortably withstand structural macro headwinds.
Section 3 — Business Model: WTF Do They Even Do?
At its core, VRL Logistics acts as a massive B2B consolidation machine. It takes thousands of small, unorganized freight consignments from 9 lakh+ business customers, bundles them together, and routes them through a vast hub-and-spoke ecosystem.
The underlying magic relies heavily on extreme asset ownership. VRL builds its own truck bodies, houses its own maintenance facilities, and directly manages over 9,000 drivers on its corporate payroll. This self-reliant model cuts out middleman margins and guarantees incredibly low cargo claim rates of just 0.06% of total revenue.
Furthermore, cash collection is lightning-fast: 85% of bookings are executed on a “To Pay” or “Paid” spot basis, completely eliminating prolonged corporate credit lines and keeping trade receivables locked down to an industry-leading 10 days. VRL isn’t just moving boxes; it’s running a highly synchronized, automated network that systematically extracts profits from microscopic logistical inefficiencies.