General information and entertainment, not investment advice. The author is not a SEBI-registered adviser or research analyst. No recommendation, no promised returns. Markets carry risk including loss of capital. Figures may not be current. Consult a registered adviser before acting.
1. At a Glance
Revenue grew 7.74% to ₹175 Cr in FY26, modest by any standard.
Profit after tax surged 55.63% to ₹6.91 Cr — a dramatic recovery from FY25’s ₹4.42 Cr.
EPS annualised at ₹3.63, up 41% YoY. The stock trades at 74.3x this earnings number.
The company sports a 7.63% ROE and 8.43% ROCE — both single-digit returns on capital. Its balance sheet holds ₹29.9 Cr in cash against ₹52.9 Cr in debt.
The market pays 74x here. The specialty chemicals peer median sits at 28.5x. That gap invites a question worth asking.
2. Introduction
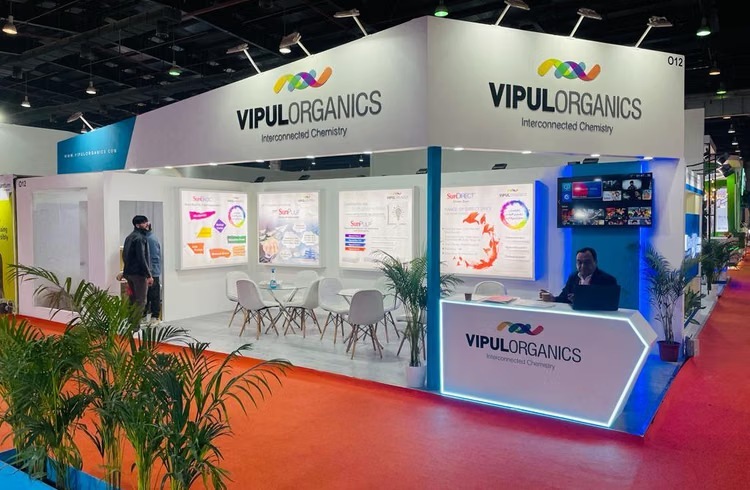
Vipul Organics manufactures and trades in dyes, organic pigments, and intermediates — the colour chemicals that tint textiles, paints, plastics, food, leather, and paper worldwide.
Incorporated in 1972, the company has operated through four manufacturing sites in Maharashtra and Gujarat. Its three-generation founding family controls 63.94% of shares. The leadership includes Chairman Vipul Shah, Executive Director Mihir Shah, and a board with production chemists and board members with decades of sector experience.
The company went public in 1995. It exports to 56+ countries — primarily Europe and the USA — and derives about 66% of revenue from exports as of latest disclosure.
Recent moves: In December 2025, the company announced the Sayakha plant would commence within ~12 weeks. This Gujarat facility upgrades pigment capacity from 2,000 to 10,000 tonnes per annum and marks entry into membrane manufacturing — a new vertical for water treatment.
In March 2026, Vipul Organics raised ₹27.54 Cr through a preferential share issuance of 13,05,400 shares at ₹211 each.
By late May 2026, it secured an exclusive European distribution partnership with Omya for its SunTone and SunCoat pigment brands.
3. Business Model: WTF Do They Even Do?
Vipul Organics is a vertically integrated specialty colour chemistry factory — raw materials to finished dispersions under one roof.
The product mix spans 13 categories and 2,400+ SKUs:
Pigments (the workhorse). Organic pigment powders — flagship SunTone brand — serve coatings, plastics, printing inks, textiles, and artistic colors. The company claims to be the world’s largest producer of Blue B Base (a key intermediate). Capacity: 3,120 MTPA across three plants, running at ~70% utilization.
Dyes (the textile darling). Reactive, direct, acid, vat, and basic dyes under the SunActive, SunDirect, SunAcid, SunVat, and SunBasic labels. These go into textiles, leather, paper, and ink. Many carry OEKO-TEX and GOTS certifications — pass-keys to premium EU and US markets.
Pigment Dispersions (the margin play). Pigments suspended in liquid form under SunCoat and SunPrint. Key differentiator: they reduce pigment loss, enable direct application, save time. The company roasts the value-add — dispersions generate better customer preference and (implied) margins than powder alone.
Naphthols and Fast Bases (the intermediates). Raw materials for downstream pigment and dye makers.
Food Colours and Lake Colours (the speciality segment). SunLake range — Halal, Kosher, GMP-compliant. Serves FMCG, pharmaceuticals, cosmetics.
Water Treatment Membranes (the new kid). AdiMem subsidiary manufactures spiral-wound and hollow-fibre membranes (MF, UF, NF, RO) for municipal, industrial, and civil water projects. Announced in April 2026 it delivered its first commercial order and targets 25% of topline revenue within 3 years.
Geography. Exports dominate — 66% as of latest disclosure. Top markets: USA (~20% of exports), Europe, and emerging markets across 50+ countries. Domestic demand from textiles, paints, plastics, and FMCG expanding.
Certifications. ISO 9001:2015 (Quality), ISO 45001:2018 (Occupational Health & Safety), ISO 14001:2015 (Environment), OEKO-TEX ECO Passport, REACH (chemical safety), GOTS (textiles), ZDHC Level 3 (restricted substances). Zero Liquid Discharge (ZLD) at Palghar facility.
The model reads as a defensive moat: full integration, certified across demanding geographies, export-heavy, 50+ years of uninterrupted manufacturing. The risk reads differently: single-digit returns, slow topline growth, execution risk on two new verticals (membranes + automotive intermediates).
4. Financials Overview
Figures are consolidated, in ₹ crore.
| Metric | Latest Q (Mar 2026) | YoY Growth | Previous Q (Dec 2025) |
|---|---|---|---|
| Revenue | 52.22 | +18.4% | 46.14 |
| EBITDA | 5.41 | — | 4.59 |
| PAT | 1.98 | +150.6% | 1.85 |
| EPS | 1.04 | +129.2% | 0.97 |
FY26 Full Year (Mar 2026): Revenue ₹175.40 Cr, PAT ₹6.91 Cr, EPS ₹3.63.
FY25 Full Year (Mar 2025): Revenue ₹162.67 Cr, PAT ₹4.42 Cr, EPS ₹2.54.
YoY Growth: Revenue +7.74%, PAT +55.63%, EPS +42.82%.
Concall Extract (from Jun 2026 investor presentation): Management attributed the PAT surge to improved operational efficiency, higher realisations, and one-time benefits. Operational profit margin (OPM) remained volatile — 9.15% in Q4 FY26 against 10.96% in Q3 FY26, suggesting seasonal or input-cost pressure in the March quarter.
The tax rate stood at 34.22% in Q4 FY26, elevated versus Q3’s 24.27%, eroding bottom-line growth relative to PBT.
5. Market Expectations & Historical Multiples
This section describes how the market is currently pricing the company and how that compares with its own history and peer group. It is descriptive, not predictive.
| Metric | Current | Historical Average (5-yr) | Peer Median (91 companies) |
|---|---|---|---|
| P/E | 74.3 | 64.1 | 28.5 |
| EV/EBITDA | 29.5 | — | — |
| P/B | 4.38 | — | 2.59 |
| ROE | 7.63% | 7.30% (5-yr) | 11.51% |
| ROCE | 8.43% | — | 14.57% |
The market currently pays 74.3x earnings for Vipul Organics, versus the peer median of 28.5x. The spread spans more than a factor of 2.5x. Over five years, the stock has averaged 64.1x — so current pricing sits modestly above its own decade-long range.
Price-to-Book is 4.38, against a peer median of 2.59. The company’s balance sheet holds ₹98 Cr in reserves (FY26) against ₹13 Cr in paid-up capital, boosting book value. The market assigns a 70% premium to peer P/B median.
ROE stands at 7.63%, below its own 5-year average of 7.30% and below the peer median of 11.51%. The company’s ability to deploy equity capital exceeds neither its historical pattern nor its peer set.
ROCE sits at 8.43%, against a peer median of 14.57%. Return on capital employed lags the peer universe by more than 6 percentage points.
What is the market pricing in? The multiple appears to embed expectations of faster future profit growth (TTM profit growth stands at 67%), recovery in capital returns (via margin expansion or capex payoff), and the new verticals (membranes, automotive intermediates) scaling faster than historical rates. The company’s 3-year profit CAGR of 54% and 1-year return of 52% suggest investor conviction that this recovery is durable.
One closing observation: The stock’s 74x multiple and 7.6% ROE coexist. If ROCE does not improve materially, the multiple rests on extrapolation — that the current profit trajectory will sustain or accelerate. History of specialty chemicals cycles suggests reversion risk.
6. What’s Cooking
Sayakha Plant Ramp (Dec 2025 announcement). Capacity upgrade: pigment powder 2,000 → 10,000 tpa. Cost: ₹39 Cr (disclosed in prior annual reports). Status: commissioning targeted within ~12 weeks from December, placing production start around early 2026 Q2. This is backward integration — naphthols and benzene derivatives (raw materials for existing pigments) manufactured in-house, reducing supply chain dependency.
Membrane Manufacturing Entry (AdiMem subsidiary). Launched April 2026 with first commercial order in hand. Management targets 25% of topline revenue from membranes within 3 years. Leader: PhD (UK), 7+ years’ experience. Exhibitions planned (overseas & Mumbai) in next 3 months. Capital invested: disclosed as part of Sayakha project cost.
Automotive Intermediates (New Customer Vertical). First commercial order fulfilled for an organic intermediate used in automotive. Approval process took 18+ months post-trial shipment. Management expects “increasing demand” in coming years, establishing “a robust revenue stream from the automotive sector.” Upside is contingent on design-win ramp and customer budget allocation.
Preferential Share Issuance (Dec 2025 & Mar 2026). ₹27.54 Cr raised at ₹211/share (13,05,400 shares). Paid-up capital increased from ₹13 Cr to ₹19.05 Cr. Stated purpose: capex for Sayakha, membrane manufacturing, and working capital.
European Distribution Pact (Jun 2026 announcement, 1 day old). Vipul Organics partners with Omya for exclusive European distribution of SunTone and SunCoat pigments. Omya is a global mineral supplier with established coatings distribution. This expands market reach in a peak EU-regulatory environment (REACH, OEKO-TEX).
Capacity Utilization Status. Total installed capacity: 3,120 MTPA. Historical utilization: ~70%. Post-Sayakha ramp: capacity rises to ~5,120 MTPA (10,000 tpa new facility minus 2,000 tpa old Sayakha unit, net addition ~8,000 tpa — exact figure pending). Ramp trajectory will be key to gauging margin accretion and capex ROI.
7. Balance Sheet
| Item | Mar 2024 | Mar 2025 | Mar 2026 |
|---|---|---|---|
| Total Assets | 136 | 155 | 231 |
| Total Liabilities | 136 | 155 | 231 |
| Net Worth | 58 | 64 | 117 |
| Borrowings | 30 | 46 | 53 |
| Other Liabilities | 48 | 45 | 61 |
Assets = Liabilities in all three years. Checks out.
Three acid observations:
The equity base nearly doubled in one year (₹58 Cr to ₹117 Cr) — ₹35.24 Cr from preferential issuance + ₹24 Cr retained profit. The dilution cuts both ways: more capital for capex, fewer earnings per share.
Borrowings climbed from ₹30 Cr to ₹53 Cr in two years. Net debt (Borrowings minus Cash) sits at ₹23.1 Cr. Against ₹6.91 Cr in FY26 PAT, that’s a 3.3x net debt-to-PAT ratio — serviceable but rising.
CWIP (Capital Work In Progress) jumped from ₹5 Cr to ₹39 Cr year-on-year. This is the Sayakha construction in progress. Capex is heavy, timing is critical.
Net Cash Position: Cash ₹29.9 Cr + Cash Equivalents disclosed as part of liquidity. Gross debt ₹52.9 Cr. Net debt ₹23 Cr. A balance sheet betting heavily on capex payoff within the next 12–18 months.
8. Cash Flow: Sab Number Game Hai
| Year | Operating Cash Flow | Investing Cash Flow | Financing Cash Flow |
|---|---|---|---|
| FY 2024 | 5 | -7 | -2 |
| FY 2025 | 1 | -15 | 15 |
| FY 2026 | 11 | -34 | 25 |
The Money Trail:
Operating cash flow recovered to ₹11 Cr in FY26 from ₹1 Cr in FY25 — a 10x improvement, though the base was tiny. The rebound suggests working capital eased (inventory and receivables management improved).
Investing cash flow turned severely negative: -₹34 Cr in FY26 versus -₹15 Cr in FY25. This is Sayakha capex in full swing — land acquisition, plant build, machinery installation.
Financing cash flow swung positive: +₹25 Cr from borrowings (new loans) and ₹27.54 Cr from equity issuance. The company funded capex via debt + equity, not from operations alone.
Free Cash Flow: Operating minus Investing = 11 – 34 = -23 Cr for FY26. The company burned cash. This is construction-phase behaviour — normal, but it means zero cash return to shareholders and reliance on external funding until Sayakha commercialises and membrane demand materialises.
One wisdom drop: A company spending 3x operating cash flow on capex is either betting the farm or has miscalculated. Vipul Organics is doing the former — a bet on the colour chemicals supercycle and new verticals. If Sayakha delivers 8,000+ tpa of pigments at higher margins, the ROI arithmetic works. If execution drags or demand softens, the leverage becomes uncomfortable.
9. Ratios: Sexy or Stressy?
| Ratio | Value | Reading |
|---|---|---|
| ROE | 7.63% | Equity is earning single digits. A business returning 7.6% on shareholder capital is underperforming treasury bonds and most long-term equity benchmarks. |
| ROCE | 8.43% | Capital employed (equity + net debt) is returning less than 8.5%. The cost of debt is ~3–4% after tax; the company is creating minimal spread. |
| P/E | 74.3 | The market assigns 74x earnings multiples to a company earning 7.6% on equity. The wedge between multiple and return suggests price reflects growth expectations, not current economics. |
| PAT Margin | 3.93% | Bottom-line margin stands at 3.93%. A 1% input-cost shock or 2% pricing pressure contracts profit 25%+. Margin volatility is built in. |
| D/E | 0.45 | Debt-to-equity at 0.45x is moderate by Indian standards. Not overleveraged, but leverage rose from 0.30x in FY24 to 0.45x in FY26 as capex borrowed. |
No ratio here flashes distress. ROE and ROCE are consistently low — structural, not cyclical. The P/E multiple is where the tension lives: it presumes that low-single-digit returns will expand materially, and soon.
10. P&L Breakdown: Show Me the Money
| Year | Revenue | EBITDA | PAT |
|---|---|---|---|
| FY 2024 | 150 | 14 | 3 |
| FY 2025 | 163 | 16 | 4 |
| FY 2026 | 175 | 17 | 7 |
The Trajectory:
Revenue grew 5% to 7.7% annually — steady but unspectacular. Over three years, the topline expanded from ₹150 Cr to ₹175 Cr — a 16.7% cumulative gain, or ~5.3% annualised.
EBITDA rose from ₹14 Cr to ₹17 Cr — proportional to revenue. EBITDA margin sits at 9.7%, stable. This suggests the company is not gaining operating leverage; volume growth is neutral to margin.
The Profit Party: PAT exploded from ₹3 Cr to ₹7 Cr in three years, but the trajectory is lumpy. FY25 cratered (₹4 Cr) — a tax anomaly and one-time items. FY26 rebounded (₹7 Cr) — same one-time tail-wind reversing, plus genuine operational recovery.
Underlying Pattern: The company grew revenue modestly, held margins flat, and rode tax variability and one-time items into a profit spike. Stripping noise, the core business is expanding slowly. The excitement is in expectations: Sayakha ramp, membrane traction, automotive intermediates, and geographic expansion via Omya.
11. Peer Comparison
| Company | Revenue (₹ Cr) | PAT (₹ Cr) | P/E |
|---|---|---|---|
| Pidilite | 14,600 | 2,459 | 63.6 |
| Navin Fluorochemicals | 3,314 | 669 | 56.0 |
| Deepak Nitrite | 7,887 | 560 | 40.7 |
| Atul | 6,274 | 678 | 28.3 |
| Aarti Industries | 8,286 | 412 | 38.8 |
| Aether Industries | 1,160 | 226 | 67.0 |
| Vipul Organics | 175 | 7 | 74.3 |
| Peer Median | 581.5 | 28.75 | 28.5 |
Size Gap: Vipul Organics is ₹175 Cr in revenue — one-third the size of the peer median (₹581.5 Cr). It is the smallest name in this set. Revenue-wise, it is dwarfed by Pidilite (83x larger), Deepak Nitrite (45x), and Aarti (47x).
Profit Gap: PAT of ₹7 Cr trails the peer median of ₹28.75 Cr by 76%. Every peer in this list generates more absolute profit, despite Vipul’s respectable 3.93% PAT margin.
Multiple Gap: Vipul trades at 74.3x, well above the peer median of 28.5x. Only Pidilite (63.6x) and Aether (67.0x) approach it. Pidilite justifies its premium via 24% EBITDA margins and 17% ROA — a different calibre of business. Aether is smaller (₹1,160 Cr revenue) but newer, with higher margins. Vipul’s 74x sits atop a 7.6% ROE and 3.9% PAT margin — a disconnect that the peer set does not mirror at this multiple.
12. Miscellaneous: Shareholding & Promoters
| Holder | % |
|---|---|
| Promoters | 63.94 |
| FIIs | 0.17 |
| Public | 35.89 |
Promoter Composition (as of Mar 2026):
Vipul Pravinchandra Shah (founder’s son): 24.68%
Mihir Vipul Shah (son 2): 16.56%
Vatsal Vipul Shah (son 3): 12.80%
Mita Vipul Shah (family): 6.41%
Vipul P Shah (HUF): 2.19%
Others (Niloni Mihir Shah, Kavita Javadsha Varaiya): 1.30%
Three-generation leadership. The founder Pravin Bhai Shah (1968) set up Kaveri Chemicals; Vipul Shah (son) took over and expanded; Mihir and Vatsal (grandsons) now run operations and strategy. Family conviction is deep — 63.94% ownership after the Mar 2026 dilution, down only marginally from 67% two years ago.
FII Near-Absence: 0.17% — institutional foreign investors have not accumulated stakes. This is a family-driven, India-focused business without global institutional backing.
Public Holding Spike: 35.89% post-dilution, up from 32% pre-issuance. The preferential offering to non-promoters was absorbed by retail and HNI ticket sizes, not marquee funds.
Promoter Track Record. 50+ years of uninterrupted dyes and pigments manufacturing. No scandals in disclosed filings. The 4.7% decline in promoter holding (Mar 2025 to Mar 2026) reflects only the equity issuance dilution, not secondary market selling. Conviction remains intact.
13. Corporate Governance: Angels or Devils?
Auditors: Deloitte Haskins & Sells (Big 4, solid).
Board Composition: Vipul Shah (CMD), Mihir Shah (ED), S.N. Sahai (chemist, independent), Megha Bhati (independent), Siddhan (independent), Rupesh Aggarwal CA (independent). Mix of promoter and independent directors; no red flags in composition.
Pledges: 0% of promoter shares pledged (latest disclosure). No collateral risk.
Related-Party Transactions: Standard — inter-company supplies, management fees to family HUF entities, dividends. Disclosures appear routine; audit committees sign off. No excesses flagged in annual reports or credit rating reports.
Resignations: No board-level departures flagged in recent announcements.
Tax Demands: None disclosed in recent filings. The company cooperates with regulators.
Credit Rating Withdrawal (Mar 2026). India Ratings downgraded Vipul Organics’ bank loan facilities from IND BB+/Negative to IND B/Negative (non-cooperating) and subsequently withdrew the rating. Rationale: the company did not provide updated financials, sanctioned facility details, or 12-month no-default statements to the agency since September 2022. The rating agency flagged this as symptomatic of “possible disruption / distress in credit profile” — though actual default is not disclosed. This is a governance weakness: poor transparency to rating agencies, even if banks are being paid on time. It signals management’s indifference to public accountability and credit market signalling.
14. Industry Roast & Macro Context
The Dyes & Pigments Sector — Commodity Inflation Meets Regulatory Walls.
India’s dyes, pigments & intermediates market is ~₹17 Bn (USD 210M equivalent), growing at 8% YoY. The sector is concentrated in Maharashtra and Gujarat — 90% of production. It is export-heavy (60%+ shipments abroad) and margin-compressed by Chinese competition and raw-material volatility.
China+1 Tailwind (Real). Western brands and retailers are diversifying sourcing away from China post-trade tensions, post-pandemic supply disruptions. India is gaining durable share in dyes and pigments — a genuine structural shift. Vipul Organics benefits from geography and certifications (REACH, OEKO-TEX) that China-based competitors struggle to match at scale.
EU Regulatory Tightening (Real). REACH (chemical safety), OEKO-TEX (sustainable textiles), and ZDHC (restricted chemicals in supply chains) are becoming non-negotiable for Western buyers. Companies without these certifications are priced out of premium markets. Vipul Organics carries most of them across its range — a moat. Competitors scrambling to certify will incur capex and time lags.
Margin Compression (Real). Raw material costs (naphthols, benzenes, amines) are commodity-linked. A 10% oil-price spike compresses input costs and erodes dyes/pigments margins by 1–3%. The company has limited pricing power in bulk dyes; it can defend margins in specialty dispersions (SunCoat, SunPrint) where application value matters more than chemical commodity price. The disparity in end-market elasticity is a secret Vipul knows but doesn’t broadcast.
Global Market Tailwind. The dyes and pigments global market was $34 Bn in 2023, targeted to grow to $65 Bn by 2030 — roughly 10% CAGR. This is structural: automotive coatings, packaging inks, textiles, food, cosmetics, and water treatment all demand pigments and dyes. Vipul’s exposure to textiles (40%+ of mix) ties it to apparel demand, which is cyclical. Exposure to paints and coatings (via SunCoat dispersions) ties it to housing and infrastructure — also cyclical, but longer duration.
Competitive Landscape. Pidilite (diversified, 24% EBITDA margin, very different business) is not a direct competitor. Direct peers: Aarti, Deepak Nitrite, Navin Fluorochemicals, Aether. These are mostly larger, with higher margins and more diversified end-markets. Vipul’s advantage: ODA/Blue B dominance, ZLD manufacturing, export scale. Vipul’s disadvantage: profitability, ROCE, and single-digit margins.
15. EduInvesting Verdict
| Strengths | Weaknesses |
|---|---|
| 50+ years of uninterrupted manufacturing; three-generation family conviction (63.94% held). | Single-digit ROCE (8.43%) and ROE (7.63%); returns not expanding year-on-year. |
| Vertically integrated across intermediates, powders, and dispersions; backward integration via Sayakha plant. | Modest revenue growth (7.74% in FY26, 5.3% CAGR over 3 years); scale disadvantage vs. peers (₹175 Cr vs. ₹581.5 Cr median). |
| Certified across REACH, OEKO-TEX, GOTS, ZDHC Level 3; qualify for premium EU/US markets. | PAT margin (3.93%) volatile; tax and one-time items swing profit sharply (FY25 showed ₹4 Cr, FY26 ₹7 Cr). |
| 56+ country export footprint; China+1 tailwind; ODA/Blue B Base dominance (world’s largest producer). | Credit rating downgrade and withdrawal (Mar 2026) signals poor transparency to rating agencies; governance weakness. |
| Exclusive European distribution pact with Omya (June 2026); new automotive intermediate vertical. | Heavy capex (₹39 Cr Sayakha, ₹15 Cr+ membrane setup) competing against low FCF; 3.3x net debt-to-PAT ratio rising. |
| Membrane (AdiMem) and automotive intermediates are unproven revenue engines; 25% topline target in 3 years is ambitious for a ₹175 Cr business. |
| Opportunities | Threats |
|---|---|
| Sayakha plant (8,000+ tpa net capacity addition) ramps in H2 FY26–FY27; margin accretion if absorbed at premium pricing. | If Sayakha ramps slowly or demand softens, the ₹39 Cr capex becomes a profit-drag; leverage rises. |
| Membrane manufacturing (AdiMem) targets 25% of topline within 3 years; water treatment is a structural growth sector (global $11.48 Bn by 2033). | Membranes are capital-intensive, IP-dependent, and compete against established players (GE, Toray, Hyflux). Vipul’s R&D is 3+ years complete; execution risk is high. |
| Automotive intermediates (new OEM customer) has 18-month approval trail; scaling could open ₹15–20 Cr annual revenue stream within 3–5 years. | Automotive sector is cyclical; design wins are fragile; customer concentration risk if one OEM dominates the channel. |
| India’s dyes/pigments market growing at 8% CAGR; global market to double by 2030. Vipul positioned as a certified supplier to EU/US buyers pivoting from China. | Regulatory tightening (REACH, ZDHC, ESG) is a moving goalpost; compliance cost rises; smaller players may be squeezed out or acquired. |
The Central Tension:
Vipul Organics holds a defensible position in specialty colour chemistry — 50 years of manufacturing, certifications that gatekeep premium markets, and a structural tailwind from China+1 and regulatory tightening. Capex is heavy, new verticals (membranes, automotive) are unproven, and the company’s current ROCE (8.43%) does not justify a 74.3x multiple. The stock’s arithmetic presumes that Sayakha + membranes + automotive will expand returns materially within 18–36 months. If they don’t, the multiple has nowhere to hide. If they do, the payoff could be durable — but execution is the arbiter, and execution in specialty chemistry capex cycles is rarely frictionless.
A balance sheet betting on capex payoff, a multiple betting on margin expansion, and a market betting on two unproven verticals. The company itself? Quietly executing on 50-year muscle memory, export logistics, and certifications. What the market sees and what the company does are increasingly divorced. That gap will narrow only when Sayakha runs and membranes scale.
