General information and entertainment, not investment advice. The author is not a SEBI-registered adviser or research analyst. No recommendation, no promised returns. Markets carry risk including loss of capital. Figures may not be current. Consult a registered adviser before acting.
1. At a Glance
V2 Retail reported FY26 revenue of ₹3,060 crore, up 62% from ₹1,885 crore in FY25. Net profit jumped 130% to ₹163 crore from ₹71 crore—the sharpest profit growth in a decade, powered by both revenue scale and margin recovery.
Yet the tension sits right in the multiple. The market prices the stock at 53x trailing earnings, against peer medians nearer 57x (Trent at 86x, Vedant Fashions at 26x). On a trailing P/B of 9.65x, the balance sheet has fattened—reserves surged from ₹310 crore (FY25) to ₹866 crore—but leverage crept up: debt climbed from ₹839 crore to ₹995 crore while cash barely budged at ₹6 crore.
The company has run a 136-store expansion to cross 325 locations, posted 9M FY26 sales-per-square-foot of ₹1,069 per month (60% above last year’s ₹862), and guided for 170–200 more stores next year. That’s ambition. Operating margins (standalone) held at ~15% despite heavy new-store dilution.
The riddle: a value retailer in Tier-II and Tier-III towns chasing 50% revenue growth annually while debt rises faster than cash, and the stock multiples in at a level the peer band doesn’t quite justify.
2. Introduction
V2 Retail Limited trades as a small-cap play in Indian value retail—apparel and lifestyle goods, 51 states and 130 cities, chiefly in Uttar Pradesh, Bihar, and Odisha. Founded in 2001, listed in 2007, the firm spent FY2022–FY2023 in the pandemic doldrums (negative net profit both years), but FY24 marked inflection: ₹1,165 crore revenue, ₹27 crore net profit. FY26 has kicked that into overdrive.
In May 2026, the board approved a ₹400 crore QIP (qualified institutional placement), already closed in November 2025 at ₹2,134 per share—nearly 9x the stock’s current ₹239. Ram Chandra Agarwal, founder and promoter (51.4% holding), renewed his stint as Chairman & MD for another five years in May 2026.
The stock hit a three-year high of ₹259 in recent months, off a low of ₹157 in the past 12 months. Momentum has been tangible: 28% one-year return, 184% over three years.
3. Business Model: WTF Do They Even Do?
V2 Retail runs a straightforward play: apparel retail for the mass market. Men’s wear (42% of revenue in 9M FY26), women’s (27%), kids (25%), lifestyle/accessories (9%).
The assortment is private label heavy—the company now sources 35% from its own brands (Ebellia, Herrlich, Glamora, Godspeed, Honey Brats) and runs an in-house manufacturing subsidiary, V2 Smart Manufacturing, producing 15–20% of apparel in-house. The rest is third-party vendor sourcing at negotiated cost.
The geographic footprint tilts to underpenetrated Tier-II and Tier-III towns. No e-commerce meaningful revenue (less than 1% from V2kart, Amazon, Myntra tie-ups). The model is brick-and-mortar, cluster-based rollout, standardized store formats, and rapid inventory turns.
Cost structure: raw material runs 45% of sales (post-inventory adjustments), employee costs ~8%, selling/admin ~7%, depreciation ~6%, interest ~3%. Gross margins (reported) have inched to 30% in FY26 from 29% in FY25—a small win against inflation, achieved through fresher inventory, better inter-store transfers, and reduced markdown pressure.
The company says its full-price mix (90% in FY26) is climbing; management wants to shed the “discount retail” label and lean toward “affordable fashion.” Store productivity has exploded: sales per square foot per month jumped from ₹857 in 9M FY25 to ₹1,069 in 9M FY26—a 25% leap—mostly driven by same-store sales growth (~8.6% in FY26) rather than ASP (average selling price rose just 11% to ₹293).
4. Financials Overview
Figures are consolidated, in ₹ crore.
| Metric | FY25 | FY26 | YoY Change |
|---|---|---|---|
| Revenue | 1,885 | 3,060 | +62% |
| EBITDA | 258 | 455 | +77% |
| PAT | 71 | 163 | +130% |
| EPS | 2.05 | 4.48 | +118% |
FY26 marked a decisive operational inflection. Revenue scaled from ₹1,885 crore to ₹3,060 crore. The PBT trajectory: ₹97 crore (FY25) to ₹216 crore (FY26)—a 122% jump. After ₹52 crore tax (24% effective rate), net profit landed at ₹163 crore.
Operating profit (EBIT) clocked ₹311 crore (FY26), up from ₹163 crore (FY25). EBITDA grew 77% to ₹455 crore, yielding a 14.9% margin—marginally higher than FY25’s 13.7%.
Depreciation shot up to ₹181 crore from ₹95 crore—a material jump. Management cited a one-time accounting reclassification in Q4 (small consumable items like tags, hangers shifted from capitalization to expense); the impact was ₹6–7 crore. Lease accounting under Ind AS 116 also drove a ₹2,769 crore exceptional gain (tax-adjusted ₹2,072 crore) in October 2025, reflecting revised store closure expectations and lease term reassessments.
Interest expense rose to ₹96 crore from ₹68 crore—a 41% jump—reflecting higher average debt and a tighter rate environment.
Q3 FY26 (Quarter ended Dec 31, 2025):
Revenue surged to ₹927 crore, up 144% YoY from ₹380 crore in Q3 FY25. Net profit landed at ₹99 crore (a record quarterly profit), versus a ₹2.5 crore loss in Q3 FY25. Operating profit hit ₹177 crore.
5. Market Expectations & Historical Multiples
This section describes how the market is currently pricing the company and how that compares with its own history and peer group. It is descriptive, not predictive.
The market assigns V2 Retail a trailing P/E of 53.3x on FY26 earnings of ₹4.48 per share and a current price of ₹239 (prices referenced are not live; data is as of June 9, 2026). On a P/B of 9.65x, the stock trades at nearly 10 times net book value.
| Metric | Current | Historical Avg (5-yr) | Peer Median |
|---|---|---|---|
| P/E | 53.3x | 91.0x | 56.8x |
| EV/EBITDA | 20.5x | — | — |
| P/B | 9.65x | — | 4.92x |
| ROE | 18.1% | 12.8% | 12.96% |
| ROCE | 16.5% | — | 13.80% |
The market currently pays 53x earnings, nearly aligned with the peer median of 57x despite the company having materially rebuilt its return profile. Over the past five years, the stock has traded at an average P/E of 91x, reflecting years when profit was suppressed or negative; at present multiples, the stock sits well below that range.
The peer set (Trent, Lenskart, AB Lifestyle, Vedant Fashions, Aditya Vision) shows a median P/B of 4.92x; V2 Retail’s 9.65x sits at a premium, mirrored by a superior ROE (18.1% versus peer median of 13%) and ROCE (16.5% versus 13.8%).
The market appears to be pricing in sustained revenue growth (the company has guided for 50%+ growth over two years), the risk of new-store dilution on near-term margins, and the execution risk of reaching 500+ stores. The elevated multiple relative to historical norms reflects belief that the business has transitioned from a turnaround to a growth play.
6. What’s Cooking
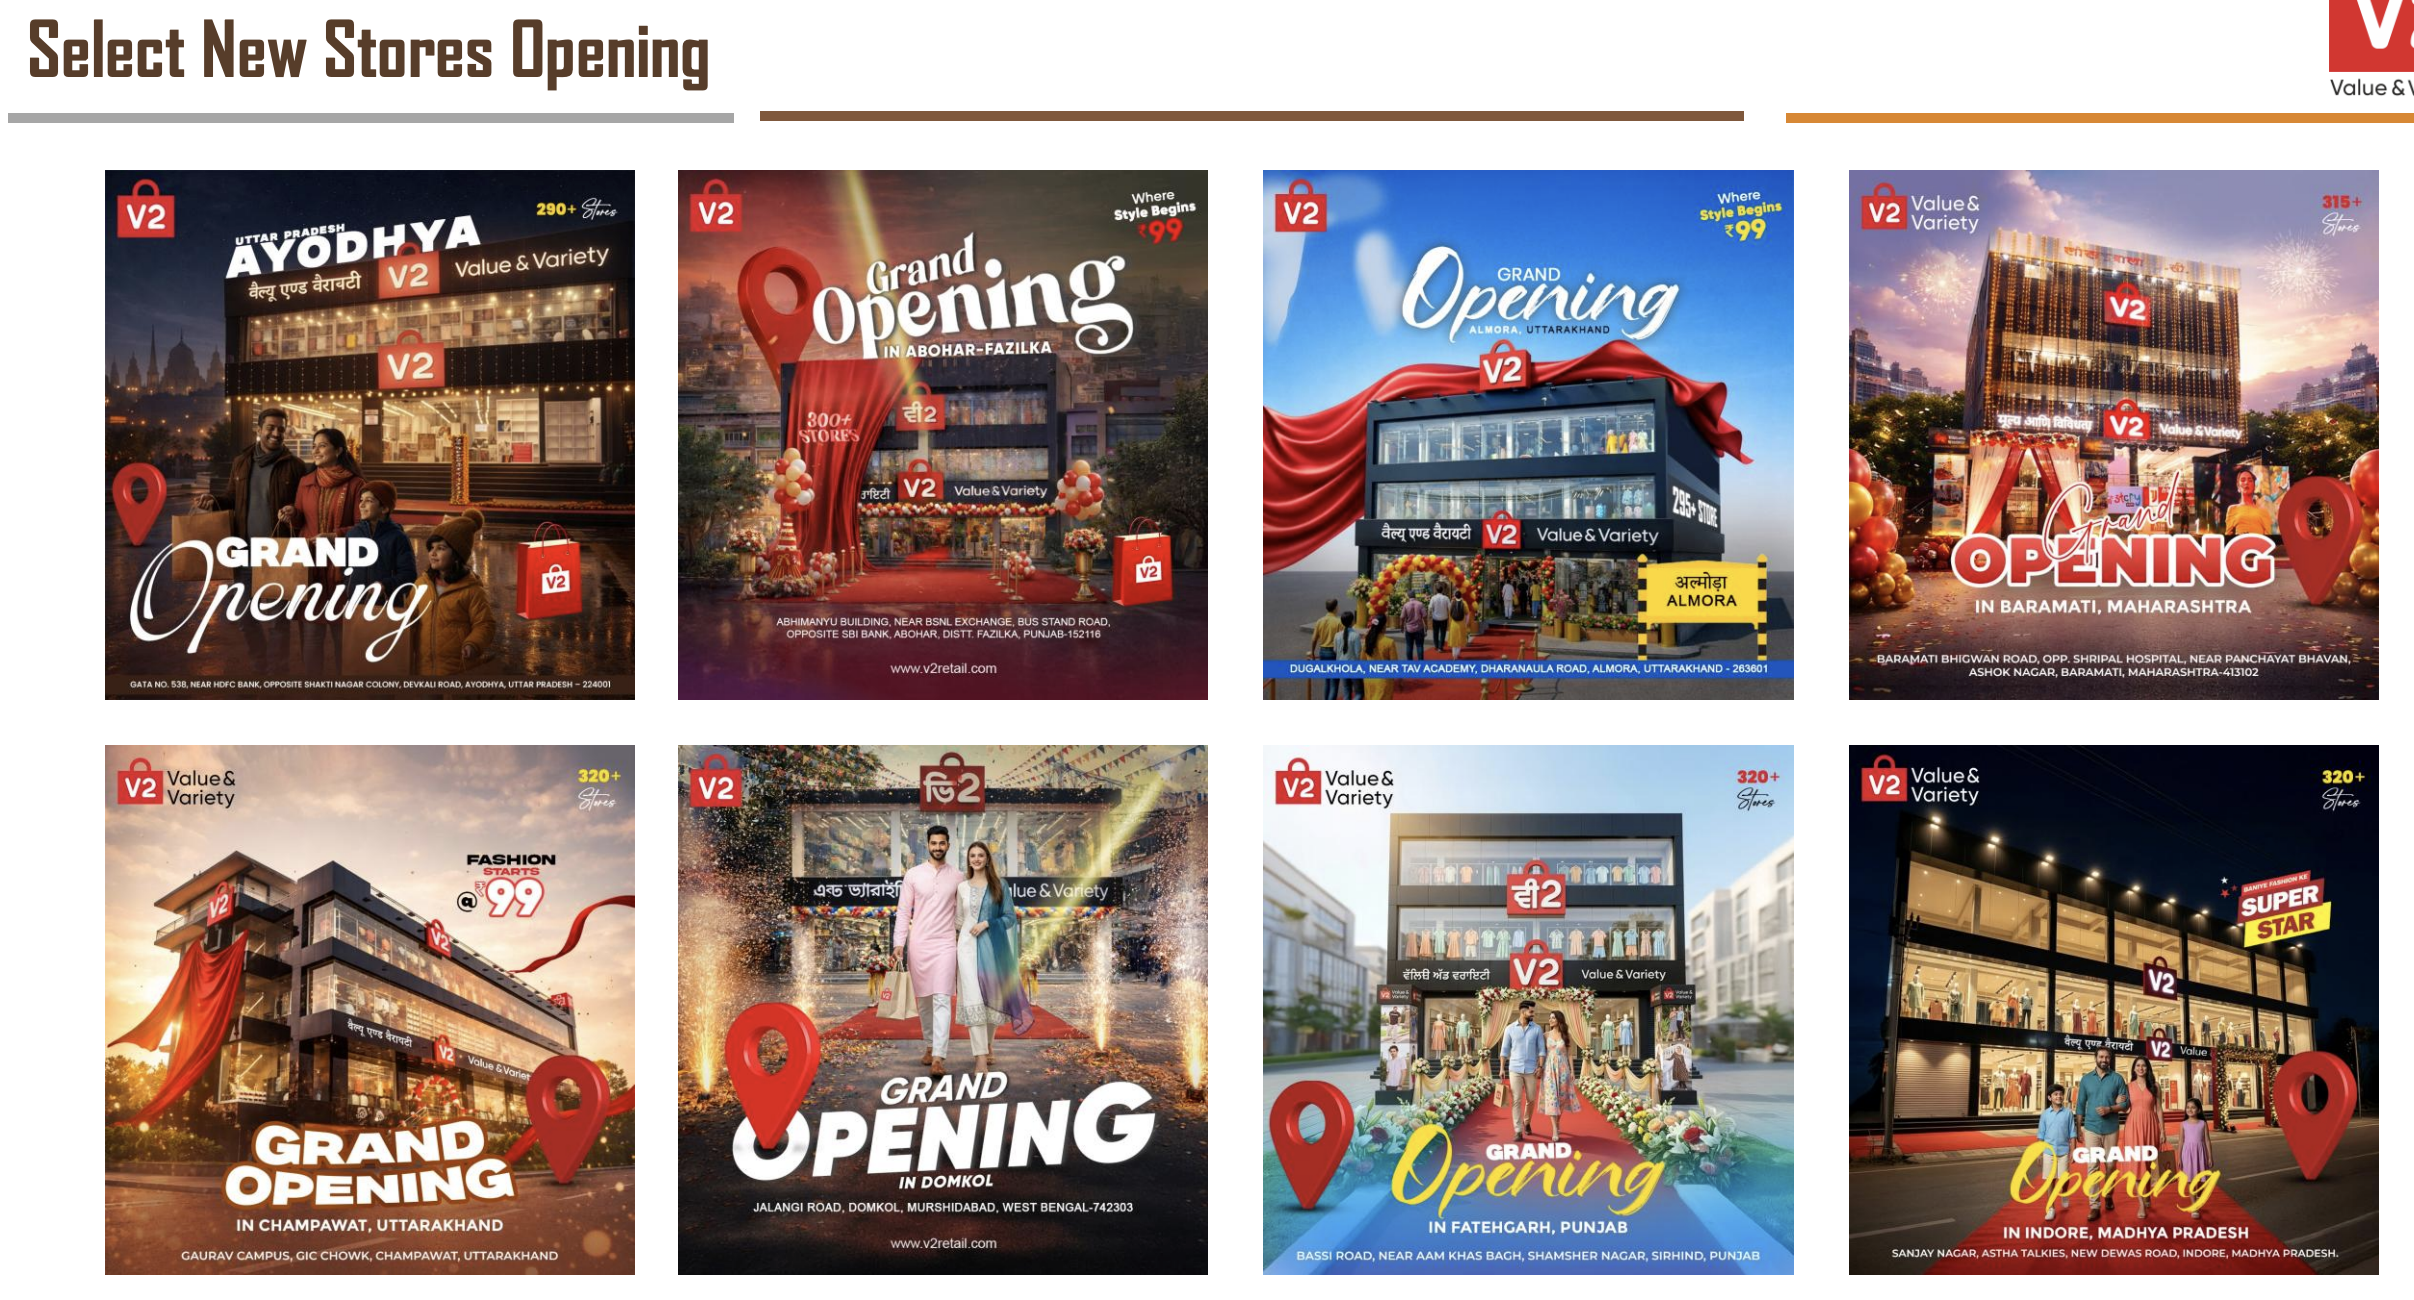
Store Expansion Velocity: FY26 saw 136 store additions to reach 325 locations (management narrative cited “over 350” at one point; the audited count as of March 31, 2026 was 325). FY27 guidance calls for 170–200 new stores. At this pace, a 50% area expansion annually is embedded.
New-State Playbook: The company is entering newer geographies (Maharashtra, Gujarat, and southern states) with a “4–5 store pilot” strategy to gather assortment, sizing, and color data before scaling. 30–40% of openings will target newer regions; 50–60% will deepen core markets.
Financing from QIP: In November 2025, the company raised ₹400 crore via qualified institutional placement, issuing 1.87 crore shares at ₹2,134 per share. This inflated equity capital from ₹35 crore (FY25) to ₹36 crore (FY26); retained earnings swelled reserves by ₹556 crore. The capital supports FY27 expansion and working-capital headroom.
Margin Guidance & Full-Price Mix: Management has committed to defend gross margins in the 28–30% range despite input-cost inflation (cotton, yarn up 4–5% YoY). The strategy is to pass through ~3–4% via small ASP increases (₹300 ASP implies a ₹10–12 ticket bump) without triggering demand shock. Full-price mix (goods sold at MRP, not markdown) hit 90% in FY26; management targets 91%.
Working Capital Tightness: Inventory age improved materially: <5% is >1 year old, ~50% is <3 months old. The company targets 90–100 days inventory steady-state and negotiates 45-day creditor terms. Inventory density (rupees of stock per sq ft) is ₹2,500–2,600, implying a current run-rate inventory requirement of ~₹900 crore at current footprint. In March 2026, the company held extra stock (₹1,140 crore inventory on the balance sheet) to support Q1 FY27 openings and pre-hedge geopolitical supply risk.
Lease Accounting Reshuffle: The Ind AS 116 reassessment in October 2025 reduced right-of-use (ROU) assets by ₹4,839 crore and lease liabilities by ₹4,992 crore, reflecting a revised assumption that stores will run 2–3 years before closure/non-renewal decisions. This boosted reported net profit by ₹2,072 crore (post-tax) in Q3, though operating lease obligations and cash rents remain unchanged.
7. Balance Sheet: Show Me the Liabilities
| Item | FY24 | FY25 | FY26 |
|---|---|---|---|
| Total Assets | 966 | 1,599 | 2,422 |
| Equity Capital | 35 | 35 | 36 |
| Reserves | 240 | 310 | 866 |
| Borrowings | 502 | 839 | 995 |
| Other Liabilities | 189 | 415 | 525 |
Total assets ballooned to ₹2,422 crore from ₹1,599 crore in FY25—a 52% jump. The asset base now sports ₹968 crore in PPE (stores, fixtures), ₹66 crore in ROU assets (post-Ind AS 116 restatement), and ₹1,140 crore in inventory.
Equity swelled from ₹345 crore (FY25) to ₹902 crore (FY26): ₹366 million fresh capital via QIP and ₹556 crore retained earnings. Debt rose from ₹839 crore to ₹995 crore—a 19% increase, well below the 62% revenue growth. Cash balance languished at ₹6 crore versus ₹9 crore in FY25; the company is effectively running a high-inventory, high-leverage model.
Three observations:
- The balance sheet has fattened faster than profit—reserve growth (+181%) far exceeds profit growth (130%), suggesting the QIP dilution isn’t yet flowing into returns.
- Net debt sits at ₹989 crore; debt-to-equity of 1.10x is moderate, but the ratio obscures working-capital intensity: at ₹900 crore running inventory, the company is essentially funding growth through increased borrowings and vendor credit.
- Other liabilities jumped from ₹415 crore to ₹525 crore, chiefly trade payables (₹46 crore for MSME, ₹41 crore for non-MSME suppliers), lease liabilities (₹17 crore current), and employee provisions.
Wisdom line: A balance sheet that has tripled in two years is either building fortress reserves or running a treadmill. V2 Retail is doing both.
8. Cash Flow: Sab Number Game Hai
| Year | Operating | Investing | Financing |
|---|---|---|---|
| FY24 | 85 | -29 | -52 |
| FY25 | 213 | -128 | -83 |
| FY26 | -96 | -231 | 325 |
FY26 operating cash flow turned sharply negative: -₹96 crore, driven by a ₹612 crore surge in inventory (March year-end safety stock) and ₹14.2 crore increase in trade payables (timing of vendor settlements). The underlying cash-generation potential is masked by working-capital lumps at fiscal close.
Investing cash flow showed -₹231 crore: ₹231 crore capex on stores, fixtures, and warehousing. Capital intensity (capex + inventory per new store) is running ₹2.7–2.8 crore per location, up from ₹2.6 crore historically due to inflation.
Financing cash inflow hit +₹325 crore—the QIP proceeds and net borrowing additions—more than offsetting operational and investing drains. Free cash flow (operating less investing) clocked -₹327 crore, a mirror of the heavy capex and inventory build year-end. Management expects FY27 to see better operational cash as inventory normalizes and the capital base settles.
Wisdom line: A company raising ₹400 crore via QIP and borrowing net ₹156 crore to fund expansion is betting growth and conversion beat working-capital drag. It’s betting it hasn’t yet.
9. Ratios: Sexy or Stressy?
| Ratio | Value |
|---|---|
| ROE | 18.1% |
| ROCE | 16.5% |
| P/E | 53.3x |
| PAT Margin | 5.3% |
| D/E | 1.10x |
ROE of 18.1%: The equity base earned ₹163 crore profit on ₹902 crore net worth. That’s a healthy spread above cost of capital (~10%) and above the peer median of 13%, signaling the business model has legs.
ROCE of 16.5%: Capital employed (equity plus net debt) of ₹1,891 crore generated ₹311 crore EBIT. The return is respectable but not fortress-level; peers like Vedant Fashions clock 23.5% ROCE, Trent 28.3%.
P/E of 53.3x: The market is pricing growth. A 53x multiple implies the company is expected to grow earnings faster than GDP and sustain returns above cost of equity for the foreseeable future.
PAT Margin of 5.3%: Net profit of ₹163 crore on ₹3,060 crore revenue. That’s thin—retail is competitive, and every percentage point of margin matters. Trent’s PAT margin sits at 8.6%; Vedant’s at 26%.
D/E of 1.10x: Debt of ₹995 crore against equity of ₹902 crore is moderately leveraged, manageable but not conservative. Interest coverage (EBIT ÷ interest) sits at 3.2x—a cushion, but not a fortress.
10. P&L Breakdown: Show Me the Money
| Year | Revenue | EBITDA | PAT |
|---|---|---|---|
| FY24 | 1,165 | — | 27 |
| FY25 | 1,885 | 258 | 71 |
| FY26 | 3,060 | 455 | 163 |
The business has scaled in a straight line. FY24–FY26 revenue CAGR hit 62%. Profit CAGR landed at 145%—an outlier, driven partly by the low base (FY24’s ₹27 crore was itself recovery from years of losses).
FY26 EBITDA of ₹455 crore on ₹3,060 crore revenue yields a 14.9% margin—marginally above FY25 (13.7%). The lift came from gross-margin recovery (30% in FY26 versus 29% in FY25) and operating leverage, partially offset by higher depreciation (one-time reclassification effects).
After depreciation (₹181 crore), interest (₹96 crore), and tax (₹52 crore), net profit expanded 130% to ₹163 crore.
The trajectory shows a retailer that has exited its doldrums and is running at full throttle. Whether throttle equals profit sustainability or just volume scaling into thin margins remains the tension.
11. Peer Comparison
| Company | Revenue (Cr) | PAT (Cr) | P/E | ROCE % |
|---|---|---|---|---|
| Trent | 20,074 | 1,726 | 85.6 | 28.3 |
| Lenskart | 8,814 | 503 | 174.0 | 8.4 |
| AB Lifestyle | 8,396 | 209 | 57.4 | 14.7 |
| Vedant Fashions | 1,435 | 376 | 26.1 | 23.6 |
| V2 Retail | 3,060 | 163 | 53.3 | 16.5 |
| Peer Median | — | — | 56.8 | 13.8 |
V2 Retail sits at the small end of the peer set by revenue (₹3,060 crore, 15% of Trent’s ₹20,074 crore). On P/E, it’s 6% below the peer median of 56.8x, a modest discount despite the company’s smaller scale and emerging store base.
Trent trades at 85.6x—the most expensive—on the back of consistent 25%+ profit growth and 28% ROCE. Vedant Fashions, the cheapest comparator, is a seasonal fashion (ethnic wear) player with 26% ROCE but thinner absolute scale.
V2 Retail’s ROCE of 16.5% beats Lenskart’s 8.4% (eyewear retail, capital-light) but trails Trent and Vedant. The company’s growth profile (50%+ guided) is ambitious; whether it can sustain profitability at that pace will determine if the 53x multiple proves justified or inflated.
12. Miscellaneous: Shareholding & Promoters
| Holder | % |
|---|---|
| Promoters | 51.4 |
| Institutions (DII/FII) | 11.9 |
| Public | 36.7 |
The promoter bloc—chiefly Ricon Commodities Pvt Ltd (35.3%, controlled by Ram Chandra Agarwal) and family members—holds a tight 51.4%. The founder’s 25-year track record in retail (he built Vishal Megamart from 2001) carries weight, though the brand’s near-collapse in 2011 and multi-year losses through FY23 temper the enthusiasm.
DIIs (domestic institutions) hold 9.3%, up from 4.3% three years ago—a sign of institutional buying into the recovery narrative. FIIs hold just 2.6%, a modest weight for a ₹8,740 crore market-cap company, suggesting global money is still sizing up the story.
The public float (36.7%) is modest relative to market cap; retail participation is growing but not dominant. The promoter lock-in at majority ownership reduces takeover risk but also concentrates governance and strategic decisions in a single shareholder.
Promoter view: Ram Chandra Agarwal, aged ~60, was reappointed as Chairman & MD for five years in May 2026, signaling continuity. He has stated the 20-year vision is 2,500 V2 stores—a 7–8x expansion from the current 325. His skin in the game remains deep (51.4% stake); so does the governance risk if execution falters.
13. Corporate Governance: Angels or Devils?
Audit & Compliance: Singhi & Co., the statutory auditors, issued unmodified (clean) audit opinions for FY26 consolidated and standalone financials. The prior-year qualification around aged advances to Bennett Coleman & Co. (₹128.8 crore for advertising services, outstanding since April 2019) was resolved: the contract was extended to July 2026, and management remains confident of utilization.
Board & Related Party: The board comprises Ram Chandra Agarwal (Chairman & MD), Vishal Waterworld Pvt Ltd (co-founder’s entity, 3.9% shareholding), and independent directors. Related-party transactions include inter-company sales (V2 Smart Manufacturing subsidiary), store lease rentals, and management fees to promoter entities—all disclosed in notes.
Pledges & Red Flags: Promoter pledging stands at 1.79% of shares—modest, non-alarming. No major tax demands or regulatory action cited in FY26 disclosures.
CEO Departure: In April 2025, CEO Manshu Tandon resigned due to personal reasons. The transition was smooth; the founder-promoter (who built the business) is directly managing operations with CFO Pratik Adukia handling finance. No material disruption flagged.
Lease Accounting Reshuffle (Red): The October 2025 Ind AS 116 reassessment—which reduced ROU assets by ₹4,839 crore and liabilities by ₹4,992 crore to reflect revised store closure timelines—was material and required management judgment on lease terms. The auditors concurred, but the scale of the adjustment (₹2,769 crore gain) merits scrutiny into the underpinning assumptions about store viability.
Labor Code Transition (Monitor): The Government’s unified labor codes (effective November 21, 2025) consolidated four prior codes. Management assessed the incremental impact as immaterial and recognized it in FY26 results. However, labor-intensive retail faces wage-inflation risks going forward.
14. Industry Roast & Macro Context
Indian retail is a paradox: 95% unorganized (small shops, street vendors, kirana stores) and 5% organized (mall chains, hypermarkets, e-commerce). V2 Retail operates in the organized apparel retail slice, chiefly brick-and-mortar.
Competitive Pressures: Trent (Westside, Zudio) dominates the mid-market. Aditya Birla Fashions (Abof) competes in the value-to-mid segment. Unorganized players (local tailors, street markets) are relentless on price and convenience. E-commerce (Amazon, Myntra, Meesho) is eating into physical store foot-traffic, though apparel try-on still favors in-store.
Inventory Risk: Retail is cyclical and trend-sensitive. Apparel obsolescence (fashion rotation, seasonal swings) is endemic. V2 Retail’s 9M inventory aging (76% <6 months, 50% <3 months) is disciplined, but the ₹612 crore year-end inventory build signals either over-caution or stock buildup ahead of a demand slowdown.
Supply Chain Headwinds: Raw material (cotton, yarn) inflation has spiked 4–5% YoY. The company has absorbed some margin pressure and is selectively passing through price (ASP +11%), but sustained input cost creep will test margin defense.
Regional Exposure: The company’s heavy tilt to Uttar Pradesh, Bihar, and Odisha (East and North India) provides growth upside in underpenetrated markets but concentrates execution risk. Agricultural slowdowns or local political disruptions (elections, statewide holidays) can hit footfall.
Geopolitical Blip: Management noted “a little sale impact in May” due to the ongoing war (presumed Israel-Hamas). The comment is casual—no quantified impact—but suggests supply-chain jitters and potential consumer caution are real.
15. EduInvesting Verdict
| Dimension | Assessment |
|---|---|
| Strengths | 62% YoY revenue growth; 130% profit growth; store economics improving (new stores hit ₹750 PSF in Year 1 against ₹500 breakeven); proprietary brands (35% of revenue) building differentiation; Tier-II/III underserved market with runway. |
| Weaknesses | Thin 5.3% PAT margin in competitive retail; 53.3x P/E near peer median despite smaller scale; negative FY26 operating cash flow masked by inventory lumps; 1.1x debt-to-equity with debt rising faster than profit growth; execution risk on 170–200 store target in FY27. |
| Opportunities | Tier-II/III market penetration (current 325 stores, target 2,500 per founder); full-price mix (90%, target 91%) reducing markdown dependence; private-label scale (35%, target 80%) improving margins; geographic diversification into Maharashtra, Gujarat, South India. |
| Threats | Unorganized retail price competition; apparel obsolescence; supply-chain inflation (cotton +4–5%); e-commerce cannibalization; leverage rising faster than FCF; margin compression if same-store sales growth slows. |
A balance sheet with nothing to hide, a multiple with everything to prove.
The company has executed a genuine turnaround—from loss-making to 130% profit growth, from a dying brand to a scaled retail network with improving unit economics. The equity capital raise was prudent capital-raising, and management’s guided 50% annual growth is ambitious but not impossible in an underpenetrated market.
Yet the 53.3x P/E sits right at peer median, not below it—meaning the market has priced the growth narrative in. The risk is binary: if same-store sales growth sustains at 8–10% and margins hold at 14–15%, the company scales into a justified valuation. If growth slows, margin pressure resurfaces, or the new-store rollout stumbles, the multiple offers no margin of safety.
The founder’s 51.4% stake and 20-year vision frame this as a long-duration bet, not a quick trade. Execution in FY27—whether 170 stores open on budget, whether margins defend, whether leverage peaks or continues climbing—will determine if V2 Retail is building a retail juggernaut or stretching into overreach.
