General information and entertainment, not investment advice. The author is not a SEBI-registered adviser or research analyst. No recommendation, no promised returns. Markets carry risk including loss of capital. Figures may not be current. Consult a registered adviser before acting.
Prices referenced are not live. This article uses CMP data dated June 10, 2026, at ₹1,150 per share.
1. At a Glance
The company reported FY26 revenue of ₹240 crore, down 1% year-on-year despite a 19.6% surge in Q4 revenue to ₹82 crore—its strongest quarter in two years.
Net profit crashed 24% to ₹63 crore, but Q4 profit bounced 10% to ₹26 crore, signaling a demand recovery that management framed as the start of “normalization.” The lift in Q4 was real, but it was also swimming upstream: Q1-Q3 FY26 combined to ₹159 crore revenue and ₹37 crore profit—a cautionary tale of what happens when your largest customer base hits inventory rationalization and tariff turmoil simultaneously.
The balance sheet swelled with cash and investments (₹480 crore in holdings), yet working capital blew out to 649 days—a red flag that masks portfolio transformation. The stock trades at 92.5x trailing earnings, a multiple that asks everything about credibility and nothing about pricing power.
2. Introduction
Unimech Aerospace manufactures aero tooling, precision components, and mechanical assemblies for aerospace, defence, energy, and semiconductor sectors. Listed on BSE and NSE in late December 2024, it serviced 35 customers as of the concall (May 2026), with 89% of revenue from exports.
FY26 was a tale of two halves: the first nine months suffered from what management termed “elevated tariff-related disruptions in the U.S., customer inventory rationalization, and softer shipment schedules.” By Q4, “inventory rebuilding has resumed and order patterns are steadily normalizing.” Whether this bounce is durable or a one-quarter flash remains the central tension.
The company expanded its footprint via a Saudi JV (announced Jan 2026, Yusuf Bin Ahmed Kanoo Group, 51% stake), completed the Hobel Bellows acquisition (April 2026, ₹450 crore), and raised its order book to ₹314 crore by May ’26—more than double its historical run-rate. Despite the headline order growth, near-term profitability is muddied by acquisition integration costs and the JV’s multi-year capex cycle.
3. Business Model: WTF Do They Even Do?
Unimech is an aero-centric tooling business that’s trying to become something broader.
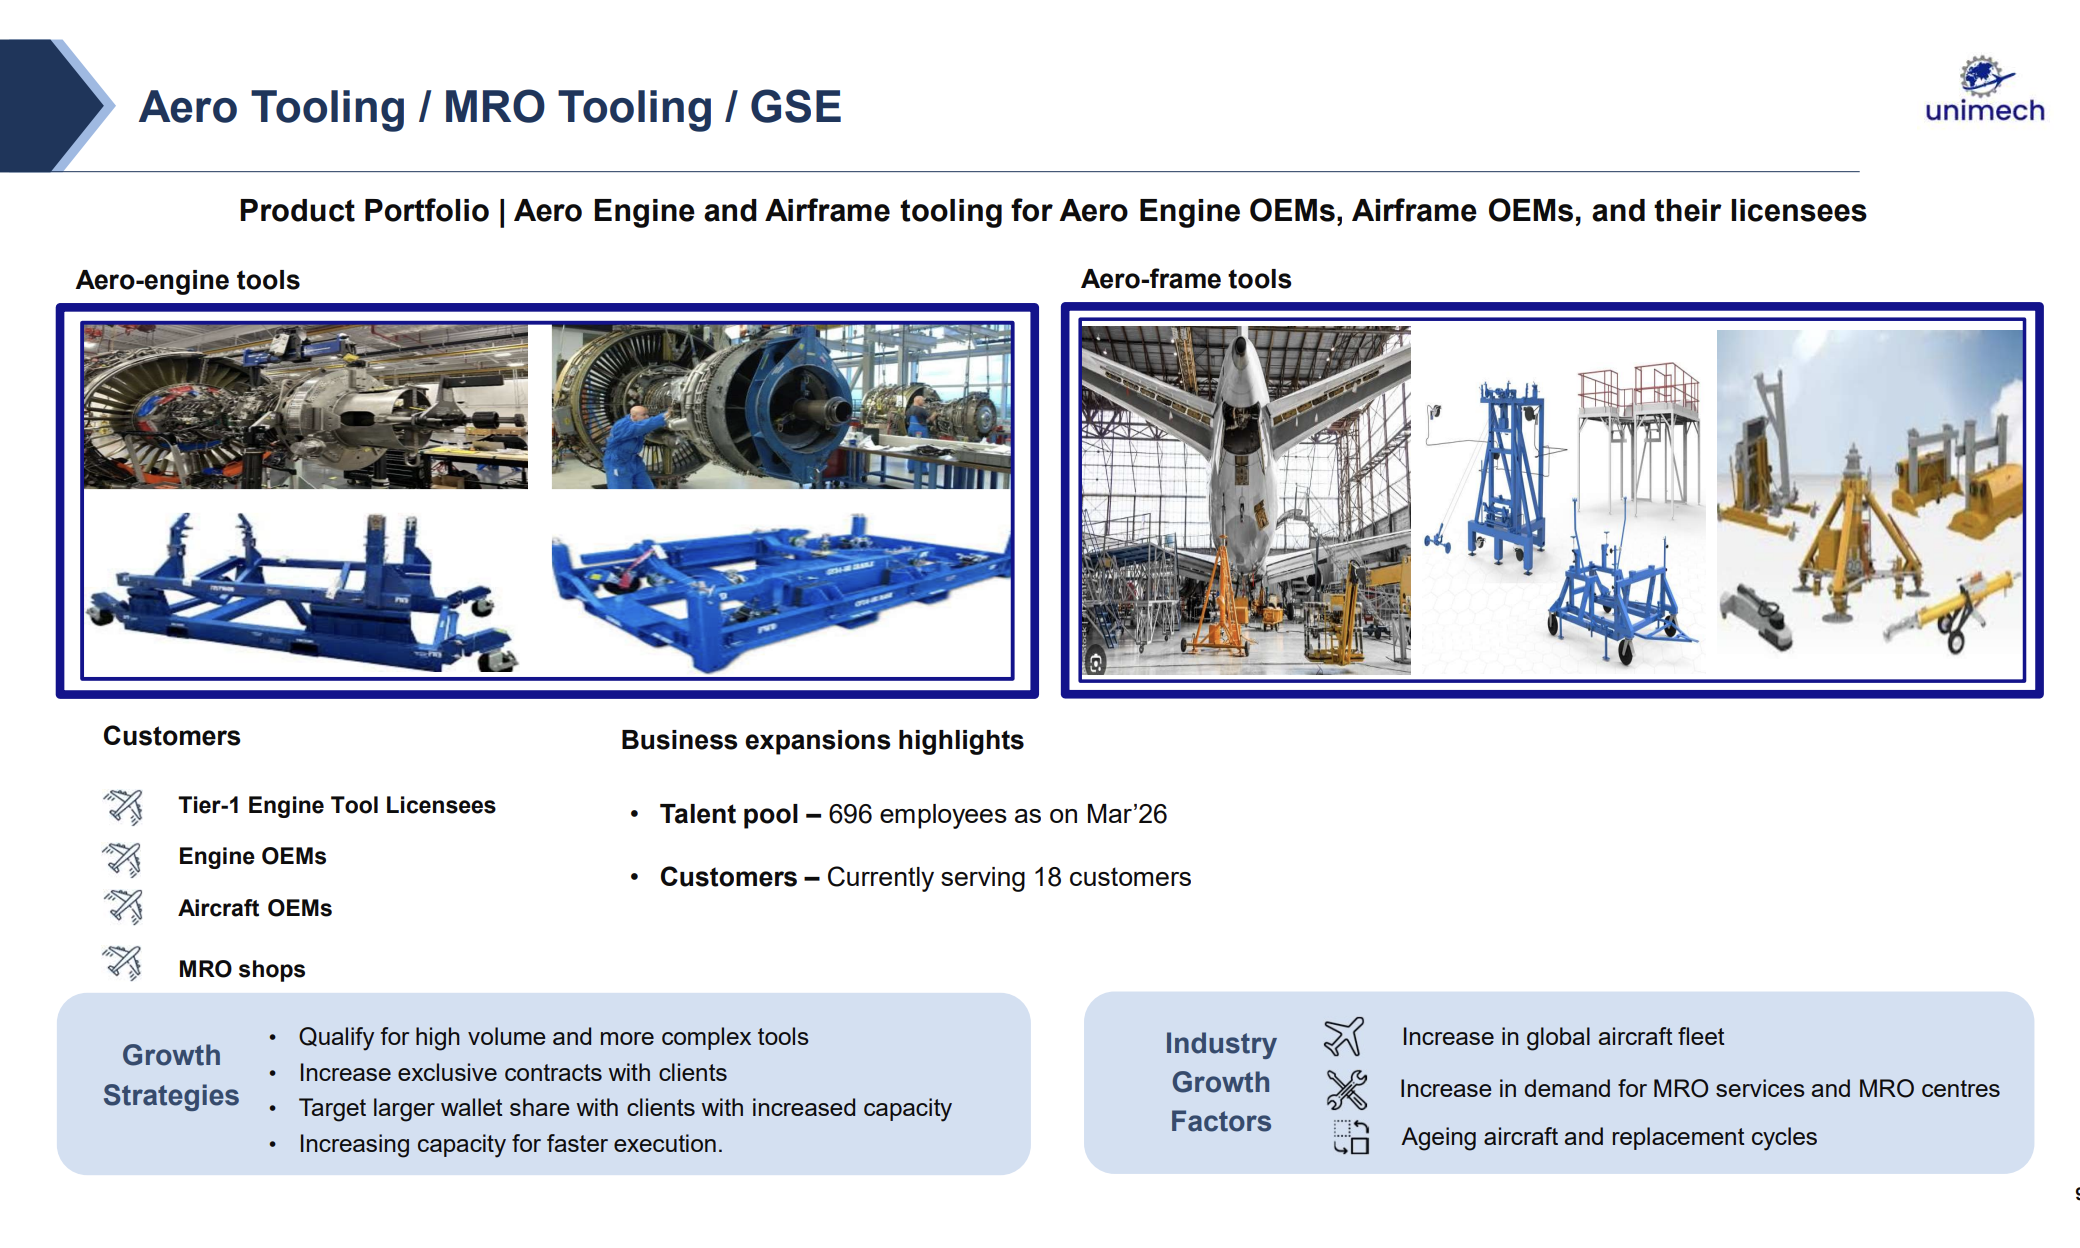
Aero tooling dominates: 90%+ of FY26 revenue came from aero engine and airframe tooling for original equipment manufacturers (OEMs), their licensees, and maintenance/repair/overhaul shops. Clients include Air Bus, Boeing, GE Aerospace, Rolls Royce, and Dassault. These are high-mix, low-volume products with execution cycles of 4–6 months for recurring orders, requiring qualification (FAI), AS9100 certification, and relationships built over years.
Precision parts and assemblies form the second tier: nuclear, defence, semiconductors, energy. These command higher margins (management cited ~73% gross margin on aero mix in Q4) but execute on longer cycles (12–18 months for nuclear). FY26 saw ₹87 crore in nuclear order wins, a deliberate push into higher-value complexity.
The Hobel Bellows acquisition (closed April) adds metallic bellows, flexible tubing, sheet metal fabrication, and tube bending—capabilities that Unimech did not have in-house and that management positioned as a bridge to “larger, more integrated packages of work.” Hobel is a 290-person, 200,000 sq. ft. facility in Visakhapatnam SEZ with ~90% export revenue and customer relationships spanning 13+ years in Europe and North America.
The model’s friction: high-mix tooling doesn’t scale linearly. You can’t triple output by hiring or buying machines; every new customer is a qualification loop, and every order is semi-custom. The playbook is customer penetration, wallet share expansion, and capability depth—not volume hockey-stick. Management acknowledged this plainly: “high-mix, low-volume” is structural, and revenue conversion from qualifications is “lagged by design.”
4. Financials Overview
Figures are consolidated, in ₹ crore, quarterly and annual basis.
| Metric | Q4 FY26 | Q4 FY25 | YoY | Q3 FY26 | QoQ | FY26 | FY25 | YoY |
|---|---|---|---|---|---|---|---|---|
| Revenue | 81.8 | 68.4 | +19.6% | 62.0 | +31.9% | 240.5 | 242.9 | -1.0% |
| EBITDA | 35.2 | 27.5 | +28.0% | 1.5 | +2187% | 75.1 | 92.1 | -18.4% |
| PAT | 26.1 | 29.2 | -10.6% | 2.4 | +994% | 63.3 | 83.5 | -24.1% |
| EPS (₹) | 5.13 | 5.74 | -10.6% | 0.47 | — | 12.4 | 16.4 | -24.4% |
Q4 FY26 performance (vs Q4 FY25): Revenue rebounded sharply, driven by “normalization in aerospace tooling demand and the release of deferred customer orders.” Operating profit margin improved to 43%, versus 40% a year prior. The quarter was the strongest of FY26—a statement of fact, not forecast.
Full-year FY26: Consolidated revenue held roughly flat at ₹240.5 crore, but the composition matters. Management disclosed that FY26 revenue net of tariff concessions was >₹240 crore; the gross figure was ₹257 crore, implying ~₹17 crore (~7%) in tariff-related concessions absorbed by the company. Profitability took a 24% hit: PAT fell to ₹63.3 crore from ₹83.5 crore. The margin compression (PAT% from 34% to 26%) reflected three headwinds: (a) cost absorption from “substantial portion of cost absorption occurred during Q3” (per CFO), (b) employee cost inflation (+16% YoY to 22% of revenue, partly from year-long hiring), and (c) non-operating volatility.
Non-operating adjustments: Other income surged ₹47 crore in FY26 (+90% YoY) from treasury deployment of IPO proceeds. Finance cost jumped to ₹15.4 crore from ₹4.5 crore, largely due to a one-off forex loss of ₹9.6 crore. CFO stated that underlying finance cost was ~₹5.7 crore (working capital), and both “other income will be very moderate in next year” (funds now deployed to M&A) and forex should normalize. Stripping these out: operational profitability is steadier than the bottom-line suggests, but still pressured by inflation and tariff drag.
Near-term driver: Management expects Q1 FY27 revenue to “surpass Q4 FY26 revenues” (baselining Q4 at ~₹82 crore) and consolidated margins “better than FY26” (i.e., >26% PAT margin). However, it cautioned that the Saudi JV ramp “may pull down on the margin profile… as a year whole,” signaling uneven margin trajectory while new platforms scale.
5. Market Expectations & Historical Multiples
This section describes how the market is currently pricing the company and how that compares with its own history and peer group. It is descriptive, not predictive.
| Metric | Current (CMP ₹1,150) | Historical Average (3Y) | Peer Median |
|---|---|---|---|
| P/E | 92.5 | 75–80 | 62.1 |
| EV/EBITDA | 48.0 | 40–50 | 35–45 |
| Price-to-Book | 7.98 | 8–10 | 8.2 |
| ROE | 9.0% | 17.0% | 12.6% |
| ROCE | 11.8% | 22.0% | 15.5% |
The market pays 92.5x trailing earnings, above its own 5-year average of roughly 64x and the peer median of 62x. The data suggests the market is pricing in either recovery to historical profitability (FY25 earned ₹83.5 crore; if FY27 replicates that, P/E falls to 70x) or structural margin expansion. Yet ROE and ROCE have both deteriorated: ROE from 16% (last year) to 9% (trailing annualized), and ROCE from 22% to 12%, partly from capex drag (₹55 crore net addition in FY26 ballooned the asset base). The company is paying a multiple that assumes recovery, but recovery requires execution on integration (Hobel), margin stabilization post-tariff, and order-to-revenue conversion in a high-mix regime—all lagged phenomena.
EV/EBITDA at 48x (against a peer median of ~35x) reflects the same tension: the market is betting on volume normalization and operating leverage, but the peer set (larger, more scale-oriented players) suggests the industry baseline is 35–45x, not 48x.
The disconnect is not a prediction; it’s an observation. Expectations are constructive but elevated.
6. What’s Cooking
Nuclear and Defence Expansion: The subsidiary won a ₹72.2 crore NPCIL order (announced Jan 2026) for nuclear support equipment, with deliveries through December 2028. FY26 saw ~₹87 crore in total nuclear order wins. This is meaningful: nuclear projects run 12–18 months, larger wallet per customer, and higher complexity—a deliberate portfolio shift away from single-customer MRO tooling dependency.
Hobel Bellows Acquisition (₹450 crore): Closed April 2026. Adds 290 people, 200,000 sq. ft. SEZ facility in Visakhapatnam, and a 13+ year track record with European/North American OEMs. Management plans AS9100 certification within 6–9 months, followed by NADCAP approvals (a 2–3 year process for aerospace). Hobel’s order book stood at ₹107 crore as of May ’26, and it’s expected to be EPS-accretive near-term and ROCE-dilutive until scale. Goodwill creation is anticipated but “not something that needs to be amortized or expensed out” (per CFO), a statement that suggests intangible asset treatment rather than scheduled amortization—a technicality, but relevant for assessing true economic earnings.
Saudi JV (Yusuf Bin Ahmed Kanoo Group): Announced Jan 2026, regulatory approval received. 51% Unimech stake in a USD30 million joint investment (Unimech’s share ~USD15 million) for advanced machining/remanufacturing in Dammam, Saudi Arabia. Expected breakeven in Year 3, targeting USD80 million revenue by Year 5. Capex-heavy ramp. First three years’ capex “largely covered” by the investment envelope. Positioned as geographic diversification and resilience against evolving trade dynamics, with potential demand from oil/gas, utilities, and mining in the region.
Dheya Engineering (30% stake, Exclusive Manufacturing Partner): DET-500 micro gas turbine validated at 90% load capacity (500+ minutes runtime, 100+ test cycles, zero major failures). Initial order from a Tier-1 defence supplier for two engines for validation, with potential to scale to ~200 units subject to qualification. ECU and hydrogen blower programs progressing. Strategic relevance to Unimech: if Dheya’s propulsion controls scale, Unimech becomes the exclusive supplier of an emerging high-mix defence product.
Free Trade Warehousing Zone (FTWZ): Approvals complete; final enablement pending. Use case: customers maintain inventory for non-U.S. territory, supplying from India to regional markets. Management expects “risk mitigation” and “stickiness of customer” once operational.
7. Balance Sheet: Assets & Liabilities
| Item | FY25 (₹ Cr) | FY26 (₹ Cr) | Change |
|---|---|---|---|
| Net Block (Fixed Assets) | 162.2 | 198.2 | +22% |
| Investments & Liquid Holdings | 343.5 | 479.6 | +40% |
| Receivables | 55.0 | 64.8 | +18% |
| Inventory | 19.8 | 25.1 | +27% |
| Cash & Bank | 142.5 | 123.4 | -13% |
| Total Assets | 807.2 | 923.6 | +14% |
| Equity Capital + Reserves | 668.9 | 737.4 | +10% |
| Borrowings (Short + Long) | 425.7 | 400.7 | -6% |
| Other Liabilities | 77.2 | 88.7 | +15% |
| Total Liabilities | 807.2 | 923.6 | +14% |
The balance sheet’s story: Assets grew 14%, driven by capex (net block +22%), treasury investments (+40% to ₹480 crore, up from ₹343 crore), and working capital buildup (receivables +18%, inventory +27%). Equity grew 10%, while debt fell 6%—a healthier debt/equity posture (D/E improved from 0.64 to 0.54). Cash dipped 13% to ₹123 crore, partly deployed to the Hobel acquisition and JV setup.
Three bullets on the numbers:
- The ₹480 crore investment portfolio is a treasury play, not a business asset. It’s a deployment of IPO proceeds earmarked for M&A, JVs, and capex. Management flagged it will normalize (“other income will be very moderate in next year”), so relying on interest/dividend income to subsidize operating earnings is a beginner’s error.
- Working capital days exploded to 649 from 108 a year prior. This is not a red flag—it’s a structural reclassification. Receivables and inventory both ticked up modestly in absolute terms (₹65 Cr and ₹25 Cr respectively), but payables grew slowly (₹19 Cr vs ₹16 Cr). The arithmetic stinks, but the context is Hobel consolidation (which brought its own WC profile) and pre-delivery inventory for large orders (nuclear, Saudi JV setup). Monitor, don’t panic.
- Capex intensity is stepping up. Net capex in FY26 was ₹55 crore. Management flagged “do not foresee very significant core business CAPEX” in FY27, except Saudi JV capex (phased). Depreciation has tripled (₹26 crore in FY26 vs ₹4 crore in FY25), a lagging effect of the facility buildout. The asset turnover ratio (Sales ÷ Fixed Assets) fell to 1.2x from 1.5x, indicating the newly added capacity is still ramping utilization.
8. Cash Flow: Sab Number Game Hai
| Year | Operating CF (₹ Cr) | Investing CF (₹ Cr) | Financing CF (₹ Cr) | Free CF (₹ Cr) |
|---|---|---|---|---|
| FY24 | 46.9 | -46.7 | 5.1 | 11.0 |
| FY25 | 81.4 | -461.4 | 514.5 | -51.0 |
| FY26 | 60.6 | -188.1 | 22.9 | 25.0 |
The path: Operating cash in FY24 and FY25 was strong (₹46–81 crore), but FY26 declined to ₹61 crore—a 26% drop despite Q4’s profit bounce. The miss reflects working capital drag (pre-delivery inventory and slow receivables conversion in a post-tariff environment) and the absence of large one-time settlements or collections.
Investing cash was negative in all three years (capex, Hobel acquisition, treasury builds), but the FY26 outflow of ₹188 crore is markedly lower than FY25’s ₹461 crore, which was a capex/facility expansion and IPO proceeds deployment year.
Free cash (operating CF minus capex-like investing) improved to ₹25 crore in FY26 from -₹51 crore in FY25—a recovery, but still muted. The company is not yet generating free cash at a rate that justifies the asset base; it’s in a “invest now, harvest later” phase.
Wisdom: High-mix manufacturing burns cash in transition. Unimech is mid-pivot: adding capacity, acquiring capability (Hobel), and diversifying geographically (Saudi JV). The cash flow will look bifurcated for the next 2–3 years—weak core operating generation offset by lumpy M&A and capex burns—before efficiency and order conversion show up as coherent cash generation.
9. Ratios: Sexy or Stressy?
| Ratio | FY26 | FY25 | 3-Year Average | Peer Median |
|---|---|---|---|---|
| ROE | 9.0% | 16.4% | 13.0% | 12.6% |
| ROCE | 11.8% | 22.0% | 18.5% | 15.5% |
| P/E | 92.5 | 58.3 | 65.0 | 62.1 |
| PAT Margin | 26.3% | 34.2% | 29.0% | 22.0% |
| Debt-to-Equity | 0.54 | 0.64 | 0.60 | 0.35 |
ROE at 9%: The equity base is earning 9 paise per rupee annually. A year ago it was 16%. The drop is partly real (lower earnings) and partly mechanical (dilution from IPO and Hobel consolidation increasing book equity). The peer median is 12.6%, so Unimech is lagging. Management’s hiring and capex spree is meant to fix this, but the payoff is multi-year. For now, equity efficiency has deflated.
ROCE at 11.8%: Capital employed (fixed assets + working capital) is generating an 11.8% return—well below the cost of capital and historical 22%. The deterioration mirrors ROE: lower earnings (numerator) and higher deployed capital (denominator, from capex and acquisition). The calculation: EBIT of ₹75 crore ÷ Capital Employed of ~₹635 crore = 11.8%. For context, peers average 15.5%. The company is in the penury zone for capital returns, a fact that justifies caution on debt-funded expansion.
P/E at 92.5x: The multiple paid per rupee of earnings is high on absolute terms and higher-than-peer terms. It reflects betting on recovery (volume normalization, margin rebound) and narrative (aero tailwinds, defence/nuclear upside, M&A as capability lift). The ratio will compress if earnings recover (FY27 ₹80+ crore PAT would yield ~57x) or deteriorate if earnings lag (FY27 ₹70 crore would yield ~82x). It’s a leverage bet.
PAT Margin at 26%: Down from 34% a year prior, it remains above peer median (22%), signaling operational pricing power despite tariff headwinds. Aero tooling command higher margins than precision parts; FY26’s mix was ≥90% aero, so the gross margin floor is sturdy. But operating expense leverage is absent: admin, employee, and facility costs grew as a % of revenue, indicating the newly added capacity and people are still underutilized. As utilization improves and revenue scales, margin expansion is possible—but it’s forward, not current.
Debt-to-Equity at 0.54: Debt fell ₹25 crore (mostly from cash generation and equity buildup). The ratio is reasonable (peer median ~0.35 is lower), and absolute debt stands at ₹401 crore against a market cap of ₹5,851 crore—manageable in absolute terms. But given the capex and JV commitments ahead, debt may creep up. CRISIL downgraded the company to BB+ (non-cooperating, Nov 2025), citing management’s non-responsiveness to rating inquiries post-acquisition and tariff upheaval. This is a factual downgrade, not a judgment; it signals the rating agency views forward credit quality as uncertain, and the company has not cooperated to provide visibility.
10. P&L Breakdown: Show Me the Money
| Year | Revenue (₹ Cr) | EBITDA (₹ Cr) | EBITDA % | PAT (₹ Cr) | PAT % | EBIT (₹ Cr) |
|---|---|---|---|---|---|---|
| FY24 | 208.8 | 79.2 | 38% | 58.1 | 28% | 74.8 |
| FY25 | 242.9 | 92.1 | 38% | 83.5 | 34% | 87.5 |
| FY26 | 240.5 | 75.1 | 31% | 63.3 | 26% | 101.4 |
The trajectory: Revenue has compounded at 8% over three years (₹209 → ₹241 → ₹240 crore)—a near-flat plateau in FY26, after two years of 16% growth. EBITDA margin collapsed from 38% (FY24–25 baseline) to 31%, a 700 basis point drop. The miss was driven by: (a) tariff concessions (~₹17 crore drag, or ~7% of revenue), (b) employee cost inflation (+₹7 crore YoY, from 18% to 22% of revenue), and (c) facility costs and depreciation (operating expenses +28%, depreciation +149%).
EBIT of ₹101 crore is higher than EBITDA—an anomaly stemming from depreciation ₹26 crore and interest/other offsets. PAT margin fell 8 percentage points to 26%, below the FY24–25 run-rate of 30–34%, signaling that operational deleveraging (fixed costs not scaling with revenue) has compressed unit economics.
The narrative: The company’s expansion capex and hiring were front-loaded in FY26; the revenue payoff is still materializing (Q4 bounce, FY27 guidance, nuclear/defence backlog, Hobel ramp). Management is explicit that margins will be “better than FY26” in FY27, implying recognition that FY26 was a trough margin year. If true, and if Q1 FY27 sustains Q4 momentum, the P&L can re-inflect. But it’s a forward statement, not a backward fact.
11. Peer Comparison
| Company | Revenue (₹ Cr) | PAT (₹ Cr) | P/E | ROCE % |
|---|---|---|---|---|
| Bharat Electronics | 27,610 | 6,062 | 49.3 | 36.5% |
| HAL (Hindustan Aeronautics) | 33,089 | 9,116 | 30.9 | 32.0% |
| Bharat Dynamics | 2,442 | 420 | 103.2 | 13.8% |
| Garden Reach Shipbuilders | 7,002 | 748 | 39.9 | 43.0% |
| Data Pattern | 925 | 274 | 89.0 | 23.3% |
| MTAR Technologies | 876 | 98 | 222.4 | 15.2% |
| Zen Technologies | 688 | 193 | 82.6 | 16.2% |
| Unimech Aero | 240 | 63 | 92.5 | 11.8% |
| Peer Median (8 cos) | 5,086 | 420 | 62.1 | 15.5% |
The landscape: Unimech is the smallest by revenue among the listed aerospace/defence peers, yet trades at a P/E (92.5x) above the median (62x) and a ROCE (11.8%) below the median (15.5%). This pricing reflects three things: (a) the market’s “growth story” thesis (Unimech is the smallest, hence optionality for expansion is highest), (b) the rarity of pure-play aero tooling—most peers are larger systems integrators or platforms, and (c) a bet on M&A and JV execution to unlock scale.
Peers like HAL (P/E 31x) and Bharat Electronics (49x) are larger, diversified, and lower-multiple because they’ve already scaled and face saturation risk. Unimech’s price premium is entirely forward-looking: it’s paying for the narrative (acquisition, JV, nuclear/defence push, margin recovery) without yet seeing it in the numbers.
That’s not a condemnation—early-stage scaling stories often trade at a premium. But it’s a fact worth noting: the market has extrapolated, and execution must catch up.
12. Shareholding & Promoters
| Holder | % Holding (Mar 2026) |
|---|---|
| Promoters | 79.8% |
| DIIs | 6.0% |
| FIIs | 0.4% |
| Public | 13.8% |
The founder four: Anil Kumar P (26.2%), Rajanikanth Balaraman (14.4%), Mani Puttan (14.4%), and Ramakrishna Kamojhala (14.4%) own ~79.8% combined, with CFO Kamojhala also doubling as Whole-Time Director. This is a founder-run shop: decision velocity is high, alignment is tight, but accountability is concentrated.
Promoter conduct: No pledging disclosed as of March 2026. The company raised ₹500 crore IPO proceeds in Dec 2024 and has deployed ~₹250 crore into M&A (Hobel) and JVs (Saudi) within 16 months—a brisk clip. The execution suggests founders have skin in the game and are willing to bet fresh capital (IPO proceeds) on capability/geographic expansion rather than taking it as fees. That’s a reasonable signal of conviction, though it also means execution risk concentrates on management’s M&A and JV integration track record (nascent, given the IPO was recent).
Resignation note: Company Secretary Akash Shetty resigned in Feb 2026. A routine move, but in the context of CRISIL’s Nov 2025 downgrade (citing management non-cooperation), it’s part of a broader picture of organizational transitions.
13. Corporate Governance: Red Flags in Context
Auditors: Statutory auditors are in place; no reporting caveats in the FY26 financial statements.
Board: Five independent directors (diverse backgrounds in forensic accounting, aerospace/defence governance, corporate law, venture capital, healthcare). The founder four are also on the board. Board composition appears balanced.
Pledging: Zero as of March 2026—a clean slate.
Related-party transactions: Disclosure of ₹450 crore acquisition (Hobel) was made post-close (April 2026), flagged in Board Meeting Outcome announcements. This is compliant with LODR Regulation 30, but the speed of close suggests limited pre-announcement scrutiny window for public shareholders.
CRISIL Downgrade (Nov 2025): The agency downgraded the corporate credit rating from A- to BB+, citing the company’s non-cooperation in providing updated financial and strategic information. The rating was withdrawn (as per the company’s request) in March 2025, so it’s no longer in force, but the downgrade statement itself (published Nov 2025) flags that credit agencies viewed the company’s credit profile as deteriorating and the company did not engage to defend the rating. This is a factual statement of communication breakdown, not a moral judgment, but it does suggest the company’s management prioritizes earnings calls over investor/creditor dialogue.
Tax demands & compliance: No material tax demands or outstanding litigations disclosed in the available filings. The FTWZ enablement (mentioned in announcements) is a customs/regulatory facility, not a compliance issue.
The red flag in context: CRISIL’s non-cooperation statement is the signal. A company that’s moving fast (acquisitions, JVs, capex, hiring) but not communicating proactively to creditors and rating agencies invites surprise downgrades. It’s not fraud; it’s opacity at velocity. For unsecured lenders and rating agencies, this is a yellow card.
14. Industry Roast & Macro Context
Aero tooling sector dynamics: The MRO (maintenance, repair, overhaul) market is growing (global commercial fleet aging, replacement cycles lengthening), but tooling is a sub-segment of capital goods within aerospace. Pricing power is weak for suppliers unless they’re locked into OEM programs or licensee contracts—Unimech has this via Air Bus, Boeing, GE, Rolls Royce, but the leverage is one-way (customer sets price, supplier absorbs volume swings).
Tariff turmoil amplifies this: when U.S. imports face tariffs, OEMs absorb or push. Unimech absorbed ~₹17 crore in FY26. That’s capital the company can’t recover unless demand normalizes and leverage reverses. The concall commentary (“continue to absorb approximately 5% tariff sharing on parts and tooling consumed within the U.S. market”) suggests the drag persists—a structural margin headwind, not a transient shock.
Supply chain localization: India is attracting aerospace manufacturing investment (defence ministry incentives, KIADB park infrastructure, labor cost arbitrage). But the domestic supply chain is still nascent; most Indian suppliers are Tier-2 or Tier-3 (component providers to global integrators). Unimech’s aspiration to move up-market (integrated assemblies, turnkey systems) requires scale and qualification depth that takes years to amass. Hobel’s acquisition is a bet on this: they have European OEM relationships and capability; Unimech brings manufacturing footprint and M&A capital. Execution risk remains.
Defence and nuclear upside: India’s defence spend is rising, and nuclear energy capacity is expanding (government target: 40 GW by 2030). These are real, but they’re also government-driven and slow (long procurement cycles, qualification requirements). The ₹87 crore in FY26 nuclear order wins are a beginning, not a flyaway. Similarly, the Saudi JV is betting on Middle East energy maintenance and localization, but geopolitical risk (trade tensions, oil price swings) are real variables management flagged but can’t control.
Semiconductor precision parts: Demand is strong (global fab capex), but competition from large Indian CNC machining shops (e.g., Quest Global, Vaida) is intense. Unimech’s moat here is certification (AS9100, IATF 16949) and aerospace-grade rigor, not uniqueness. Margin compression is a risk if the market commoditizes.
The sector roast: Aero tooling is a high-barrier, low-scale, customer-centric business in a geopolitically volatile environment. There’s no moonshot in this space, just patient relationship building, execution discipline, and capex discipline. Unimech is trying to add speed via acquisitions and JVs, which is sensible, but it’s also absorbing integration risk, forex risk, and geopolitical risk in pursuit of scale. The sector fundamentals are sound; the company’s ability to execute at this speed is the real question.
15. EduInvesting Verdict
SWOT Summary
| Strengths | Weaknesses |
|---|---|
| Aero OEM relationships (Air Bus, Boeing, GE) locked into multi-year contracts | P/E of 92.5x assumes perfect execution on M&A, margin recovery, and order conversion |
| High margin aero tooling (73% gross margin observed in Q4) | ROE 9%, ROCE 11.8%—both deteriorated and below peer/cost of capital |
| Capex and hiring largely completed; cost absorption should normalize in FY27 | Tariff drag persists (~5% margin headwind in U.S. market) |
| Order book at ₹314 crore (May ’26)—more than 1x annual revenue, vs. historical 0.4x | Working capital days at 649—exploded, though partly Hobel consolidation |
| Q4 momentum into FY27, nuclear/defence orders starting to execute | Hobel integration untested; aerospace qualification 2–3 years out |
| FII/DII holdings still minimal (0.4% FII); retail/public holding 13.8%—thin floatage risk |
| Opportunities | Threats |
|---|---|
| Hobel cross-selling into Unimech’s aero base and vice versa into Hobel’s bellows/assemblies market | Geopolitical trade volatility (tariffs, supply chain shifts) |
| Nuclear order momentum—₹87 crore in FY26, execution cadence 12–18 months, higher margins | Customer concentration (89% from 2 large OEM ecosystems) |
| Saudi JV accessing Middle East energy/oil & gas (USD80M revenue potential by Year 5) | Key-person dependency (four founders own 79.8%; exits/illness risk) |
| Dheya micro gas turbine exclusive manufacturing rights if propulsion controls qualify (200-unit potential) | Execution track record on JVs and acquisitions is nascent (Saudi JV post-announcement, Hobel closes April) |
| Semiconductor precision parts demand strong; Unimech has ₹100+ crore qualification pipeline | Absorption of tariff costs erodes competitive margins unless pricing power improves |
| FTWZ operational—niche but relevant for customer stickiness and regional supply repositioning | CRISIL downgrade (now withdrawn) signaled credit quality uncertainty and communication gaps |
Closing Observation
Unimech is a high-complexity, low-scale aero tooling business in the middle of a capability and geographic expansion that will take 3–5 years to bear fruit. The company has the right moves (Hobel adds assembly depth, Saudi JV adds region, nuclear orders add complexity and margin), but the timing is aggressive: Q4 was a bounce, but it’s not yet a trend. The balance sheet can absorb the capex and M&A (net debt ~₹280 crore against a ₹5,851 crore market cap); the question is whether operating cash and order conversion can keep pace with deployed capital.
The market prices all of this as a recovery story at a 92.5x multiple. The company’s founder-led, high-conviction bets and Q4 inflection signal credibility. But the deteriorated ROE, ROCE, and persistent tariff drag are reminders that this is an execution test, not a given. Between a balance sheet with nothing to hide and a multiple with everything to prove, the company sits precisely where a young platform in transition should sit: proving itself quarter by quarter, announcement by announcement. For now, the story is intact; the story delivering is the unfilled part.
