1. At a Glance
Thejo Engineering isn’t just about fixing conveyor belts — it’s about doing it so profitably that investors are willing to pay ₹46 for every rupee of earnings. With a market cap of ₹2,282 Cr, an ROCE of 22.1%, and a 5-year sales CAGR of 13%, Thejo serves mining, steel, cement, and ports with high-margin engineered rubber/polyurethane solutions. The order book stands at ₹222 Cr, and FY25 TTM PAT is ₹52 Cr on ₹558 Cr revenue. Yet, the stock trades at 7.66× book value, proof that market love stories sometimes defy accounting logic.
2. Introduction
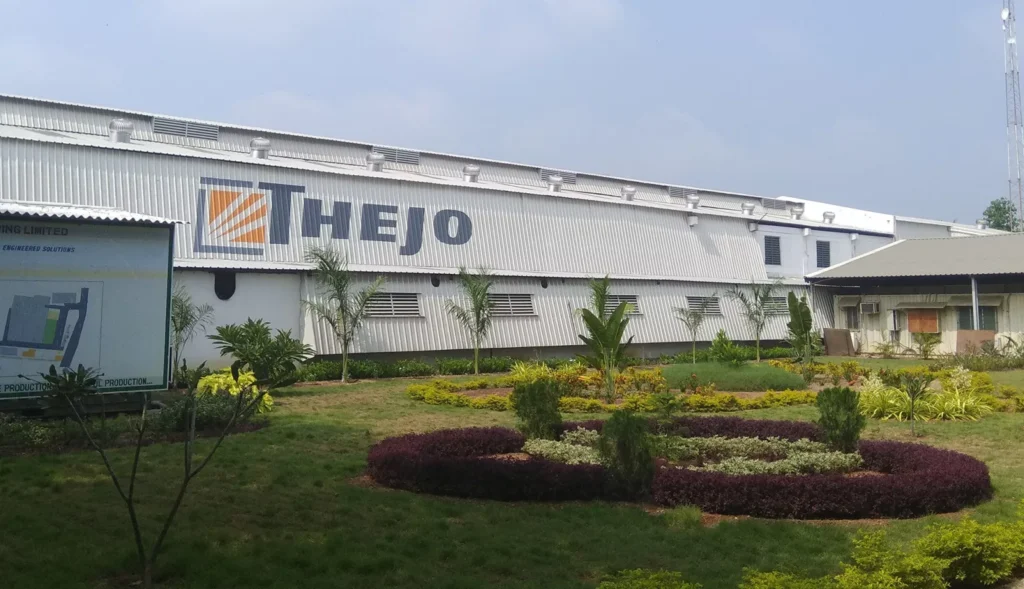
Founded in 1986 and headquartered in Chennai, Thejo Engineering has mastered the art of keeping bulk material moving without hiccups. Its core product range covers belt cleaners, impact beds, spillage control systems, wear liners, and corrosion protection gear. The clientele is spread across core sectors — mining, steel, cement, ports — industries where downtime means bleeding money.
In the last decade, sales have grown steadily, profits have surged (10-year PAT CAGR: 75% — from ₹1 Cr to ₹52 Cr), and return ratios have stayed enviable. While FY25 saw a -5% TTM PAT dip and a -27% stock price fall over the past year, the operational story remains intact. And with repeat orders from as far as Australia, Thejo’s rubber has truly gone global.
3. Business Model (WTF Do They Even Do?)
Thejo earns by manufacturing and supplying engineered polymer-based solutions for
heavy industries. Think of them as the orthopaedic surgeons for conveyor systems — diagnosing, replacing, and preventing breakdowns.
Key segments:
- Bulk Material Handling Products: Belt cleaners, trackers, skirting systems.
- Mineral Processing Equipment: Screening panels, wear protection systems.
- Corrosion Protection: Rubber lining for tanks, pipes, and vessels.
- Services: On-site installation, maintenance, and AMC contracts.
Domestic sales still dominate, but exports to Australia, Middle East, and Africa are a growing chunk.
4. Financials Overview
EPS TTM = ₹45.82 → P/E = 2104 ÷ 45.82 ≈ 45.9.
FY25 (TTM) snapshot:
- Revenue: ₹558 Cr
- EBITDA: ₹86 Cr
- PAT: ₹52 Cr
- OPM: 15%
- ROE: 18.2%
- ROCE: 22.1%
Debt has been cut to ₹30 Cr (D/E: ~0.1), freeing up cash flows for expansion.
5. Valuation – Fair Value Range
| Method | Metric Used | Multiple | Value/Share (₹) |
|---|---|---|---|
| P/E Method | EPS ₹45.82 × 30–35 | 1,374–1,604 | |
| EV/EBITDA | EBITDA ₹86 Cr × 18–20 | 1,500–1,660 | |
| DCF | Cash flows, 8% growth, 12% WACC | 1,420–1,580 |


