General information and education, not investment advice. The author is not a SEBI-registered adviser or research analyst. No recommendation, no promised returns. Markets carry risk including loss of capital. Figures may not be current. Always consult a SEBI-registered adviser.
1. At a Glance
Systematix Corporate Services sells broking, investment banking, wealth management and asset management services. Consolidated revenue for the three months to June 2026 was ₹56.26 crore. The same three months a year earlier brought in ₹39.17 crore, a rise of 43.6%. Net profit was negative ₹4.89 crore, against ₹10.46 crore in the year-ago quarter. Screener, a stock data website, records that swing as a change of 147%. Operating profit was negative ₹2.27 crore, the second quarter in a row below zero. The first was the three months to March 2026, at negative ₹9.53 crore. Revenue rose and profit turned negative inside the same three months of trading.
Inside the revenue line sits a heading that was not there before. ₹29.51 crore is booked under “Sale of shares”, absent from the comparative columns. That single line is more than half of what the quarter called income. The company’s own press release of 7 August separates the two figures out. It reports revenue of ₹56.26 crore and adjusted revenue of ₹26.75 crore. Two versions of one top line, in one sentence, and both of them correct.
Employee benefits expense of ₹20.57 crore was the largest single expense line. A rights issue put ₹35 crore into the broking subsidiary on 13 April. A subsidiary limited liability partnership was struck off the register on 21 July. The annual general meeting is scheduled for 22 September. The merchant banking segment reported a pre-tax segment loss of ₹6.52 crore.
Market capitalisation stands at ₹785 crore, and trailing profit after tax is negative ₹1.32 crore. A price-to-earnings figure compares market value with a year of profit. Screener leaves that field empty for this company.
2. Introduction
Systematix Corporate Services Ltd was established in 1985. It provides investment management and advisory services in the financial markets. Its clients include foreign institutions, development finance institutions, insurance companies and other financial institutions. Forty-one years on, the registered office is still at Bansi Trade Centre on M.G. Road, Indore. The corporate office takes four consecutive suite numbers on the sixth floor of a Bandra Kurla Complex tower. A company that grew up in Indore now works in the postcode where its clients raise money.
The group was founded by Mr CP Khandelwal. It runs today with more than 300 professionals across four businesses. Those are investment banking, equity brokerage, private wealth and asset management. Nikhil Khandelwal is Managing Director. On 7 August 2026 the board re-appointed him for a further three years. The Nomination and Remuneration Committee recommended it, and the fresh term starts on 1 September 2026. Members are asked to approve the appointment at the annual general meeting.
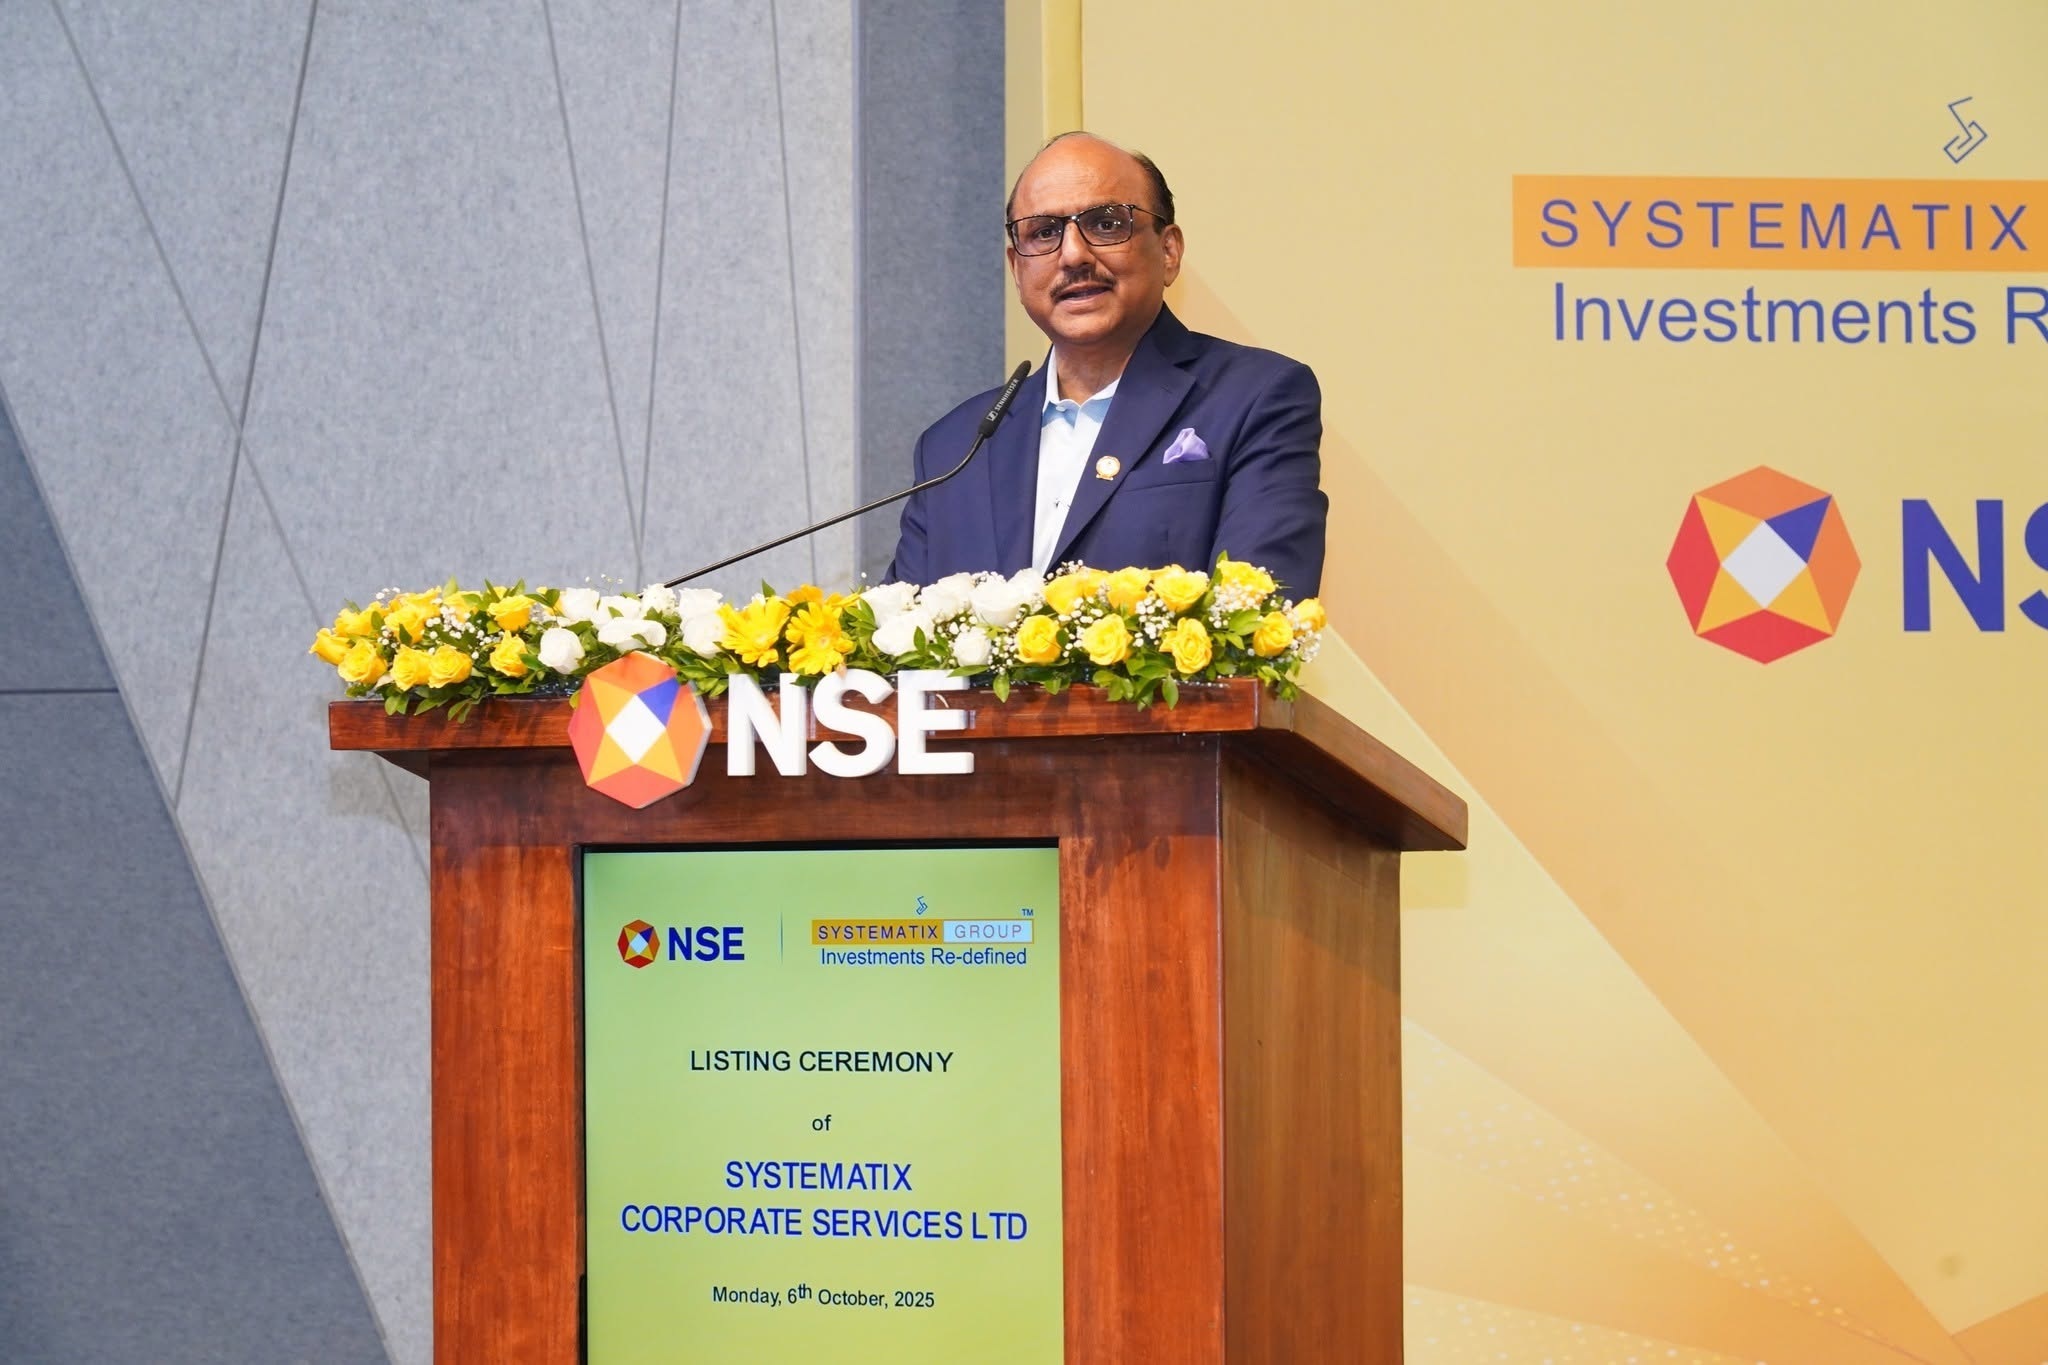
The last twenty-four months have been dense with corporate machinery. In August 2024 one equity share of ₹10 was split into ten of ₹1. A fund raise of ₹103.12 crore was announced in September 2024. In November 2024 the company allotted 67,35,430 equity shares to non-promoters. In October 2025 it listed 13,65,38,010 shares on the NSE as SYSTMTXC. That added a second exchange to a BSE listing running since the previous century. In November 2025 Bhaskar Hazra and Partha Sengupta became Joint MD and CEO of the private wealth arm. In May 2026 Rupam Lal Das was appointed Joint Managing Director. Ratnadeep Acharyya was appointed Managing Director and CEO for investment banking.
The year to March 2026 closed with revenue of ₹146.17 crore. The year before brought ₹139.39 crore, a rise of 5%. Profit before tax was ₹22.71 crore, against ₹57.09 crore a year earlier. A dividend of ten per cent was declared for the year, on a face value of ₹1. Ten per cent of one rupee is ten paise a share. The company describes a year hit by lower deal activity in Indian capital markets. It names global uncertainties, spending on the private wealth build-out and share awards to staff. It also names a mark-to-market hit, meaning listed investments it holds fell in value.
US
Now live
US Stocks terminal is live
13,000+ US tickers · EDGAR fundamentals · screener and filings feed — the same terminal, for American markets.
Explore →
3. Business Model: WTF Do They Even Do?
Four verticals sit under one holding company, alongside many entities whose names begin with the same word.
Broking brought 63% of revenue in the three months to June 2024. The share was 61% in the year to March 2022. The institutional desk covers cash and derivatives trades for domestic and foreign institutions. It has over 240 institutional clients, among them HDFC Mutual Fund, UTI Mutual Fund and IDFC Mutual Fund. Its overall cash market share was 0.57% at the end of that June quarter. Research coverage has climbed from 185 companies in the year to March 2024 to 328. The wealth management client count has been exactly 1,600 for three straight reporting years. Distribution reaches 40,000 clients through a franchisee network of 62. That network was 204 in the year to March 2024, and 70 the year after. Institutional strength is described as 145 domestic fund houses and 95 foreign ones, covering Singapore, Hong Kong and the UAE. The United Kingdom and the United States are covered as well.
Merchant and investment banking was 33% of revenue in the three months to June 2024. The share was the same in the year to March 2022. It helps medium-sized companies with capital raising, mergers, financing and deal structuring. The work also covers IPOs, rights issues, buybacks and open offers. Delistings and QIPs, which are share sales to large institutions, sit there too. Deal value transacted in the year to March 2026 was around ₹4,600 crore. Ratnaveer Precision raised ₹186 crore and Veranda Learning ₹357 crore through QIPs. GHCL raised ₹300 crore the same way. The IPOs included Indogulf Cropsciences at ₹200 crore and Mangal Electricals at ₹400 crore. Jaro Education raised ₹450 crore and Vikran Engineering ₹772 crore.