Surana Telecom and Power Ltd Mar 2026 : The ₹38.7 Crore Windfall Masking Operational Friction
Section 1 — At a Glance
Surana Telecom and Power Ltd delivered an annual revenue expansion to ₹60.79 crore in FY26 , up from ₹15.92 crore in the prior fiscal year. Net profit for the period climbed to ₹24.81 crore. However, a line-by-line inspection reveals that the headline performance is heavily underpinned by non-operating factors. Other income reached ₹38.70 crore in FY26, surpassing total operating sales and acting as the primary anchor for profitability.
Investor attention has been captured by the dramatic spike in quarterly and annual net profit metrics. Conversely, operational execution remains highly volatile. The company’s core operating profit margins hit negative territory at -4.51% for the full year , driven by a sharp rise in raw material and manufacturing expenses. Balance sheet leverage metrics expanded concurrently, with total borrowings escalating from ₹6.43 crore to ₹66.51 crore by March 31, 2026. Cash generation profiles also reversed significantly, as cash from operating activities dropped to negative ₹28.87 crore. When accounting profits surge while operational cash generation collapses, structural asset efficiency requires rigorous questioning. This analysis explores whether this temporary windfall masks persistent structural drag.
Section 2 — Introduction
Surana Telecom and Power Ltd occupies a unique, fragmented position within the domestic clean energy and manufacturing ecosystem. Established originally to manufacture telecom components and petroleum products, the business pivoted into solar and wind power generation, alongside specialized aluminum processing infrastructure.
The publication of the audited financial results for the period ending March 31, 2026, presents an essential analytical checkpoint. The corporate structure has witnessed severe operational recalibrations, including the complete abandonment and sale of underperforming subsidiary solar machinery , the total slump sale of its historical wind power portfolio , and a material expansion in balance sheet asset values funded by fresh commercial borrowings. This review evaluates the true financial run-rate of the core operations once one-off restructuring windfalls are stripped away.
Section 3 — Business Model: WTF Do They Even Do?
The company operates an eclectically diversified portfolio that reads like an industrial conglomerate shrunk down to micro-cap scale. Historically, it generated revenue through long-term Power Purchase Agreements (PPAs) tied to its 25 MW operational solar assets across various state utilities, commanding tariffs ranging between ₹5.60 and ₹15.00 per Kwh.
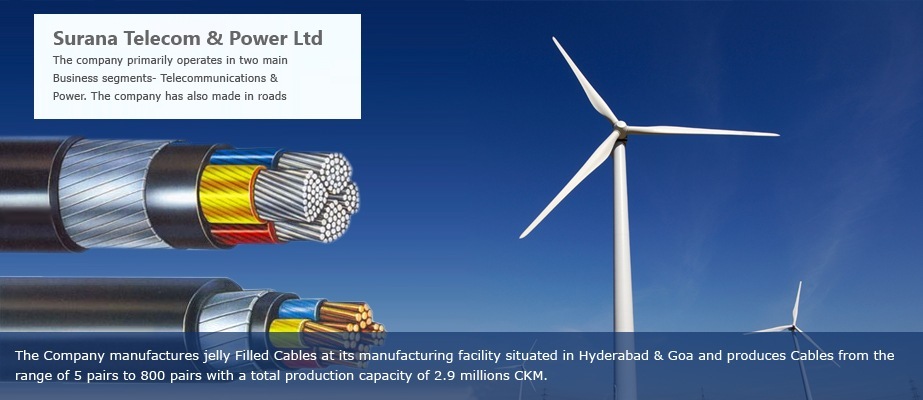
Beyond generation, the business maintains legacy capabilities in aluminum rod manufacturing, optical fiber setup, and jelly-filled telecom cables. However, the actual operational mix is in a state of flux. In recent periods, the solar power generation segment contributed the vast majority of stable business margins, while the manufacturing wings faced intense structural headwinds. The management’s strategy focuses on monetization of underutilized land banks and non-core execution assets to clear operational bottlenecks.
Section 4 — Financials Overview
Figures are consolidated, in ₹ crore.
Quarterly Performance Trend
Metric
Latest Quarter (Mar 2026)
YoY
QoQ
Revenue
23.86
400.21%
1.88%
Operating Profit
-4.52
Loss Expanded
Loss Expanded
PAT
17.34
-10.06%
330.27%
EPS (₹)
1.28
-9.86%
326.67%
The quarterly top-line surge to ₹23.86 crore is entirely stripped of utility