Suraksha Diagnostic Ltd FY26: The Price of Testing the Limits
Section 1 — At a Glance
Suraksha Diagnostic Ltd’s full-year FY26 results reveal a business expanding its physical infrastructure while absorbing significant margin trade-offs. Revenue from operations reached ₹310.41 crore, marking a 23.11% year-on-year increase from ₹252.09 crore in FY25. This growth was driven by an expanding network footprint, with the total number of diagnostic centers reaching 68 alongside 8 central laboratories. Operating profit (EBITDA) for the year grew 15.84% to ₹98.56 crore. However, the consolidated EBITDA margin compressed by 200 basis points to 31.75% compared to 33.75% in the previous fiscal year.
Profit after tax (PAT) grew by a marginal 1.35% to ₹32.19 crore, down from ₹31.82 crore in FY25, restricted by rising operational overheads, expansion-linked depreciation, and finance costs. For the fourth quarter ended March 31, 2026, revenue stood at ₹81.41 crore with a PAT of ₹6.28 crore. The business model remains heavily concentrated, with West Bengal generating 100% of functional revenue during the fiscal year. Asset productivity shows a stark divergence: mature centers (older than two years) maintained stable operating margins of 36.5%, while newer centers operated at an average EBITDA margin of -5.5%. Capital allocation sub-sectors, such as the new genomics vertical and the 63% acquisition of Fetomat, represent long-term volume plays currently in the pre-operative investment phase.
When physical asset replication outpaces immediate volume absorption, the income statement acts as a temporary shock absorber for long-term network value.
The transition from a dominant state footprint to a regional platform hinges on compressed breakeven execution across high-complexity modalities.
Section 2 — Introduction
Suraksha Diagnostic Ltd, incorporated in 2005, operates an integrated healthcare diagnostic platform combining pathology, radiology, and outpatient medical consultancy services. The company has established a dense regional presence across Eastern India, anchored primarily by its central reference laboratory infrastructure in West Bengal.
Following its initial public offering in December 2024, which raised ₹846 crore through an entire Offer for Sale (OFS), the company’s strategic focus has pivotally shifted toward aggressive physical center expansion. Management has systematically introduced high-complexity verticals, such as molecular diagnostics and next-generation sequencing, to capture incremental wallet-share from walk-in retail clients. The current execution strategy aims to duplicate its structural hub-and-spoke operational layout into adjacent, under-penetrated markets within the North-Eastern cluster.
Section 3 — Business Model: WTF Do They Even Do?
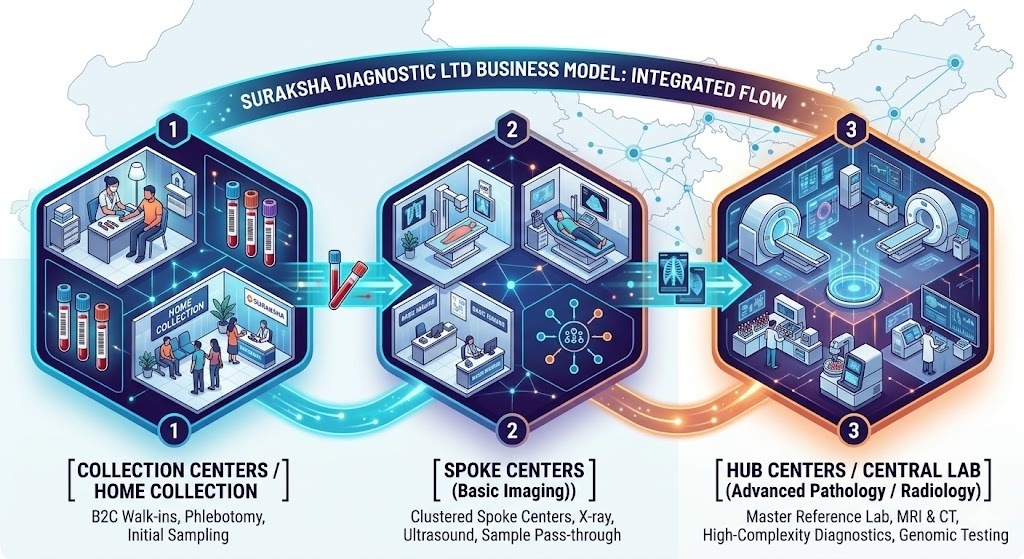
Suraksha Diagnostic runs what it formally titles an “integrated diagnostic ecosystem,” which translates to a corporate assembly line designed to capture patients at every point of medical anxiety. The business model functions on a hub-and-spoke infrastructure. At the core sit 8 high-capacity central and satellite laboratories, surrounded by 68 diagnostic centers and a web of 193 collection collection endpoints.
The revenue mix is split: pathology testing brings in 48.85%, while complex radiology (CT scans, MRIs) commands 44.26%. The remaining 6.89% is squeezed out of outpatient doctor consultations at their integrated polyclinics. Management treats these polyclinic consultation rooms as a captive referral pipeline. By hosting over 1,000 panel doctors who consult on-site, Suraksha creates an internal referral loop. A patient steps into a polyclinic room for a cough, receives a prescription, and is directed straight into the adjacent hallway to get a chest X-ray and a metabolic profile.
The strategy is overwhelmingly consumer-focused, with the Business-to-Consumer (B2C) segment delivering 89.02% of operational revenues. This configuration gives them pricing authority but subjects them to local volume fluctuations. Financially, the entire model is a pure play on local asset density: mature centers run with clear operating efficiencies, while new centers consume corporate cash while waiting for steady patient walk-ins.
Section 4 — Financials Overview
Figures are consolidated, in ₹ crore.
Headline Performance Metrics
Metric
Latest Quarter (Q4 FY26)
YoY (%)
QoQ (%)
Revenue from Operations
₹81.41
+25.07%
+4.79%
EBITDA / Operating Profit
₹24.37
+25.17%
+5.22%
PAT (Profit After Tax)
₹6.28
-3.68%
-16.49%
Reported EPS (₹)
₹1.21
-14.79%
-15.97%
The top-line numbers present a healthy surface image. Q4 FY26 revenue scaled to ₹81.41 crore, indicating that the physical volume engine is processing tests at a steady pace. Operating profit tracked this growth, coming in at ₹24.37 crore. However, the lower regions of the profit and loss sheet tell a completely different, structurally heavier story. Net profit for the final quarter contracted to ₹6.28 crore, compressed by a rising cost structure that expansion-heavy strategies inevitably invite.
Did Management Walk the Talk?
During the May 2026 earnings interaction, management attempted to redirect investor focus away from the visible compression in net margins. The CEO noted:
“The gap between our mature margins and blended margins represents a clear runway for future profitability as our newer regional hubs scale up.”
While management previously guided for stable performance, the continuous rollout of new physical locations has introduced a near-term margin drag. The cost of material consumed increased to ₹10.16 crore in Q4, while employee benefit expenses expanded to ₹13.67 crore to staff the un-monetized spokes. Depreciation rose to ₹11.26 crore, and finance charges climbed to ₹3.92 crore, reflecting the financial weight of the capital expenditure cycles. Investors should note that while top-line momentum