Sunrakshakk Industries Q4 FY26: From Textile Leftover to FMCG Gamble
General information and entertainment, not investment advice. The author is not a SEBI-registered adviser or research analyst. No recommendation, no promised returns. Markets carry risk including loss of capital. Figures may not be current. Consult a registered adviser before acting.
1. At a Glance
Revenue hit ₹197.59 Cr in Q4, up 92% YoY. That’s the headline. PAT jumped 88% to ₹12.10 Cr. But here’s the tension: margins compressed YoY on product mix, EBITDA margin fell 90 basis points to 10.19%, and operating cash flow has gone negative. The company just swallowed a ₹98.65 Cr preferential issue, pivoted from textiles to FMCG intermediates, and is now selling soap noodles to ITC and Godrej.
The FY26 P&L shows ₹607.75 Cr revenue (up 237%) and ₹34.98 Cr PAT (up 218%). Sound great in isolation. Squint closer: cash from operations turned negative (₹-34 Cr). The balance sheet inflated from ₹158 Cr to ₹324 Cr in liabilities. Free cash flow is ₹-92 Cr.
The question: is this a growth machine finally finding its legs, or a capital-intensive pivot that has yet to convert ink into cash?
2. Introduction
Sunrakshakk Industries—formerly A.K. Spintex, renamed in April 2024—spent three decades processing polyester and cotton fabric. A Process House job-work shop. Boring, low-margin, commoditised. By 2023, textiles still anchored the P&L.
Then came December 2024: the company acquired Sunrakshak Agro Products Pvt. Ltd for roughly ₹2.5 Cr (effectively consolidated from Jan 2025 onwards). The preferential issue raised ₹98.65 Cr at ₹840 per share—to fund capacity expansion in soap noodles, cosmetics, detergents, toothpaste, and edibles (spices, savories).
Two facility ramps are central: Guwahati (commissioned Jan 2026 with soap noodle and cosmetics capacity) and Bhilwara edibles expansion (online since Sept 2025). By Q4, FMCG contributed 83% of revenue vs 58% in FY25. Textile fell from 42% to 17%.
Stock price (referenced June 12, 2026) is ₹326.25. No changes to board, directors, or auditors flagged in documents. Promoters (led by Prakash Chand Chhabra via Fshion Suiting Pvt Ltd) hold 69.66%, down from 70.76% due to the preferential issue.
3. Business Model: WTF Do They Even Do?
The company now operates three geographic hubs: Bhilwara (Rajasthan), Roorkee (Uttarakhand), and Guwahati (Assam). Not integrated backward—they buy raw materials and intermediate chemicals, process them, and sell.
Textiles remain. Bhilwara still processes grey fabric (synthetic and cotton) on a job-work basis. The facility runs 45 lakh meters monthly capacity. Output: ~5.1 Cr meters in FY26. Revenue: ~₹100 Cr annualized at current run rate. Low margins, thin moat, but cash-generative if it ever was.
FMCG intermediates dominate. The company manufactures soap noodles, detergent powder intermediate chemicals, and cosmetic inputs. Output is split: 85% sold externally to large FMCG players (ITC, Jyothy Labs, Godrej, Patanjali, RCM), 15% consumed captively within the group. Five FMCG manufacturing units, 200+ customer base, monthly capacity of ~19,640 MT across soap noodles (3,000 MT Roorkee + 2,160 MT Guwahati = 5,160 MT monthly), detergent (3,500 MT), home care (1,200 MT), toothpaste (500 MT), and cosmetics (1,000 MT).
Edibles as the third leg. Bhilwara edibles facility cranks 2,500 MT monthly, split between savories (850 MT capacity) and spices (650 MT capacity). Contribution started Sept 2025, so Q4 reflects only 6 months of partial ramp. No discrete margin data; lumped into overall group.
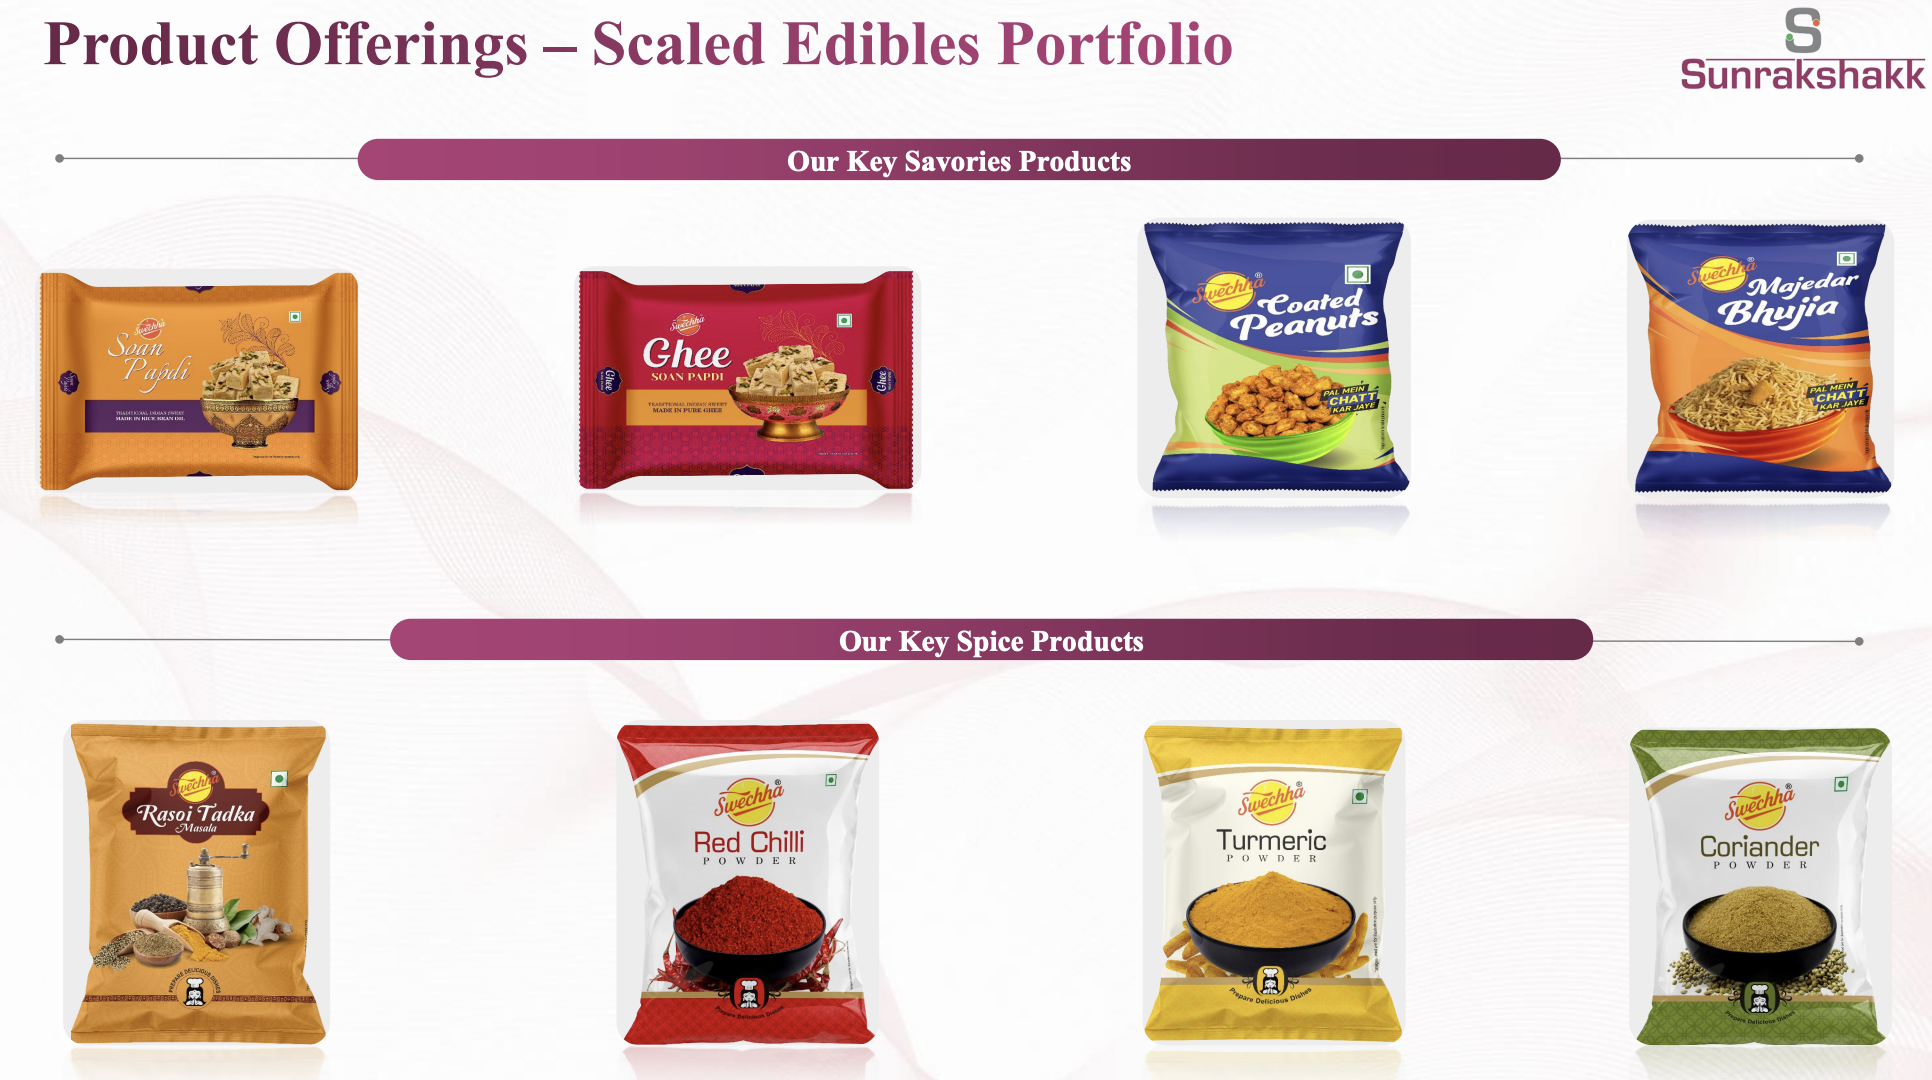
The playbook is B2B contract manufacturing. No brand to speak of. One customer owns the “Swechha” brand (seen in investor presentation)—the company just manufactures under it. Distribution is direct-to-customer, not retail. The moat is cost, quality, and delivery reliability on a job-work basis.
Capacity headroom is stated as “spare capacity in almost all categories,” particularly personal care. No near-term capex barrier to hitting stated ₹1,000 Cr FY28 topline target, per management guidance.
4. Financials Overview
Figures are consolidated, in ₹ crore.
Annual P&L (FY24, FY25, FY26):
Metric
FY24
FY25
FY26
YoY %
Revenue
117.18
180.16
607.75
+237.3%
EBITDA
~25.65
25.66
58.69
+128.7%
PAT
8.45
11.01
34.98
+217.7%
EPS (₹)
3.35
4.38
11.65
+165.9%
Quarterly P&L (Q4 FY25 vs Q4 FY26):
Metric
Q4 FY25
Q4 FY26
YoY %
QoQ (vs Q3 FY26)
Revenue
102.74
197.59
+92.3%
+20.5%
EBITDA
11.40
20.14
+76.7%
+32.0%
PAT
6.44
12.10
+87.9%
+28.6%
EPS (₹)
2.56
3.90
+52.3%
+28.7%
EBITDA Margin
11.09%
10.19%
-90 bps
+88 bps
PAT Margin
6.27%
6.12%
-15 bps
+38 bps
From the earnings call (June 3, 2026):
Management attributed Q4 margin improvement QoQ (EBITDA margin +88 bps to 10.19%, PAT margin +38 bps to 6.12%) to: ramp-up of the Guwahati facility from January 2026, better capacity utilization, and improved operating efficiencies. YoY margin compression (EBITDA -90 bps, PAT -15 bps) was attributed to “product mix”—textiles are higher-margin than FMCG intermediates and edibles. Management reiterated this segment-wise (textile, FMCG, edibles) margins are improving.
Raw material expenses surged: ₹68.88 Cr (Q4 FY25) to ₹136.95 Cr (Q4 FY26), a 119% jump. As a % of revenue, 67% in Q4 FY26 vs 67% in Q4 FY25. Management cited “a bit of pressure in terms of raw material pricing during the end of Q4 and beginning of Q1” linked to geopolitical tensions. No supply chain disruption claimed.
5. Market Expectations & Historical Multiples
This section describes how the market is currently pricing the company and how that compares with its own history and peer group. It is descriptive, not predictive.
Valuation snapshot (price ₹326.25 as of June 12, 2026):
Metric
Current
FY25 Avg
FY24 Avg
Peer Median (Textiles)
P/E
28.0
~43.7
~8.0
24.4
EV/EBITDA
17.0
~6.2
~2.6
—
P/B
5.47
~3.7
~0.7
1.77
ROE
29.6%
26.9%
27%
7.3%
ROCE
29.2%
22%
—
9.01%
Implied EPS for P/E calculation: FY26 full-year EPS is ₹11.65 (reported) from ₹34.98 Cr PAT / 3.10 Cr shares (ex-preferential). P/E = 326.25 / 11.65 = 28.0x.
The market currently pays 28x FY26 earnings here. The peer median (textiles & apparel) is 24.4x. Sunrakshakk trades above that, even as it pivots into a new, unproven business mix. The company’s own EV/EBITDA sits at 17.0x (market cap ₹1,012 Cr + net debt ₹31.9 Cr / EBITDA ₹58.69 Cr). Peers in textiles trade 6.2x to 20x.
ROE and ROCE sit at 29.6% and 29.2% respectively—well above peers (7.3% median ROE, 9.01% median ROCE). But these figures are skewed by the recent preferential issue and acquisition: the equity base swelled from ₹51.76 Cr (Mar 2025) to ₹184.98 Cr (Mar 2026), while PAT only tripled. The numerator grew faster than the denominator. As absolute profits compound, these ratios will normalize downward unless growth accelerates.
P/B of 5.47x is high; peer median is 1.77x. It reflects the market pricing in future earnings power from the FMCG platform, not current tangible book value. The company’s own 5-year average