1. At a Glance
A micro-cap ghost of real estate past, Shricon Industries Ltd posted a loss in Q1 FY26, while also reshuffling management and appointing a new CFO. With negligible revenues, a -1.17% ROCE, and a working capital cycle of 406 days, the only thing moving fast here is investor patience.
2. Introduction with Hook
Imagine a builder who forgot to build, but remembered to attend every AGM. Welcome to Shricon Industries, a BSE-listed real estate mirage floating on ₹0.02 crore quarterly revenue and dreams from 1984.
- Q1 FY26 Revenue: ₹0.02 crore
- Q1 FY26 Net Loss: ₹0.05 crore
- Market Cap: ₹19.3 crore
Oh, and ROE? A stunning -1.18%. The only thing growing is the “About Us” section on the website.
3. Business Model (WTF Do They Even Do?)
Real estate. Construction. Civil work.
Or at least, that’s what the brochure says. In reality:
- FY25 revenue was ₹0.62 crore – we’ve seen mom-and-pop kirana stores make more.
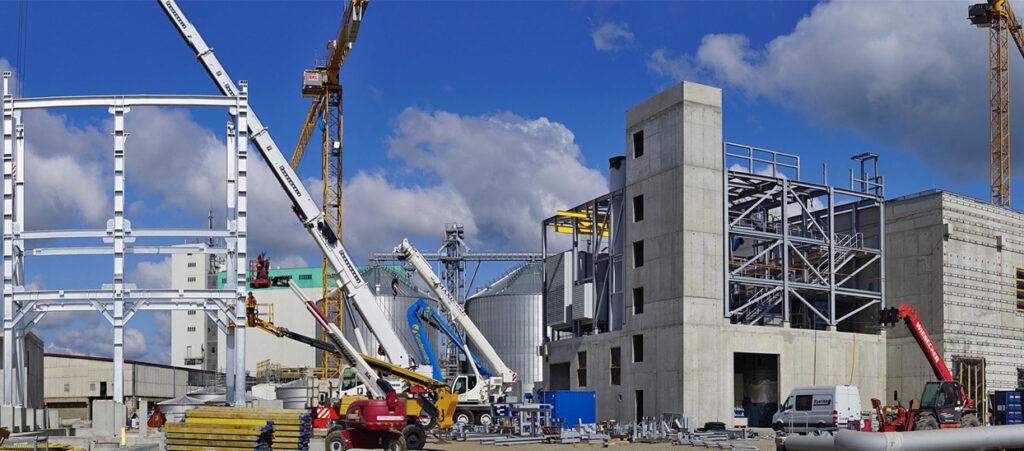
- Primary activity: Civil work (engineering construction, heavy and commercial).
- But with near-zero topline, it feels more like civil nap.
Let’s just say they’re “asset heavy” in fixed assets, but “order book light” in reality.
4. Financials Overview
| Metric | FY25 | FY24 | FY23 |
|---|---|---|---|
| Sales (₹ Cr) | 0.62 | 0.57 | 0.00 |
| Net Profit (₹ Cr) | -0.05 | 0.87 | 1.21 |
| ROE | -1.18% | 7.02% | 9.76% |
| OPM | -25% | -17.7% | -7.0% |
| Borrowings (₹ Cr) | 0.01 | 0.01 | 1.02 |
Pattern? Fluctuates between random profitability and dull losses. Earnings are mainly propped by “Other Income”, not operations.
5. Valuation
Book Value per share = ₹33.7
Current Price = ₹156
P/B Ratio = 4.63x (Yes, 4.6x for a company with negative ROE)
Fair Value Estimate (Based on fundamentals):
| Method | Fair Value Range (₹) |
|---|---|
| DCF (Optimistic) | ₹45 – ₹55 |
| P/B Benchmark (1.5x) | ₹50 – ₹60 |
| Exit Multiple (0 growth) | ₹40 – ₹55 |
EduInvesting FV Range: ₹45 to ₹60
Current valuation? Living in Lalaland.
6. What’s Cooking – News, Triggers, Drama
- Q1 FY26 Results: Revenue down 89% QoQ, net loss of ₹0.05 crore.
- Management Shuffle: Appointed Independent Director, new CFO, and Secretarial Auditor in July 2025.
- AGM Scheduled: 29 August 2025.
Trigger? Maybe a pivot. Or maybe they’ll start a podcast. Because building real estate doesn’t seem to be the goal.
7. Balance Sheet
| Item | FY25 (₹ Cr) |
|---|---|
| Equity Capital | 1.24 |
| Reserves | 2.94 |
| Total Borrowings | 0.01 |
| Fixed Assets | 2.49 |
| Investments | 0.85 |
| Total Assets | 4.20 |
Key Points:
- Debt-free. Nice.
- Fixed assets are 60% of total assets.
- Reserves declined vs FY24. Profit reversal?
8. Cash Flow – Sab Number Game Hai
| Year | CFO | CFI | CFF | Net Cash |
|---|---|---|---|---|
| FY25 | -0.07 | 0.34 | -0.65 | -0.38 |
| FY24 | -0.05 | 1.63 | -1.05 | 0.52 |
| FY23 | -0.24 | 3.29 | -3.05 | 0.00 |
Cashflow Kya Keh Raha Hai?
Operating cash flow negative every year. Survives on investing gains. Financing cash flow negative = repaying debts.
9. Ratios – Sexy or Stressy?
| Ratio | FY25 | FY24 | FY23 |
|---|---|---|---|
| ROCE | -1.17% | -1.36% | -3.62% |
| ROE | -1.18% | 7.02% | 9.76% |
| Interest Coverage | Negative | Positive | Positive |
| Working Capital Days | 406 | 19 | 21 |
Takeaway: 406 working capital days? That’s 13 months. Not a typo. Stressy af.
10. P&L Breakdown – Show Me the Money
| Metric | Q1 FY26 | Q4 FY25 | Q1 FY25 |
|---|---|---|---|
| Sales | ₹0.02 Cr | ₹0.34 Cr | ₹0.22 Cr |
| Expenses | ₹0.10 Cr | ₹0.31 Cr | ₹0.26 Cr |
| Operating Profit | -₹0.08 Cr | ₹0.03 Cr | -₹0.04 Cr |
| Other Income | ₹0.03 Cr | ₹0.05 Cr | ₹0.08 Cr |
| Net Profit | -₹0.05 Cr | ₹0.08 Cr | ₹0.01 Cr |
Core business = negligible. The lifeline is Other Income. It’s like selling soap and living off the rent.
11. Peer Comparison
| Company | CMP | P/E | Sales (Qtr) | ROCE | ROE | PAT (Qtr) |
|---|---|---|---|---|---|---|
| EFC (I) | ₹348 | 30.7 | ₹211 Cr | 21.3% | 23.3% | ₹47.96 Cr |
| P.E. Analytics | ₹209 | 17.0 | ₹21.6 Cr | 21.3% | 15.5% | ₹6.44 Cr |
| Homesfy Realty | ₹284 | 66.5 | ₹28.4 Cr | 4.6% | 3.0% | -₹0.05 Cr |
| Shricon | ₹156 | NA | ₹0.02 Cr | -1.17% | -1.18% | -₹0.05 Cr |
Even among small caps, Shricon is the most micro and most financially challenged.
12. Miscellaneous – Shareholding, Promoters
| Category | % Holding |
|---|---|
| Promoters | 70.84% |
| Public | 29.15% |
| No. of Shareholders | 352 (as of Jun 2025) |
Steady promoter holding, no pledges. But with such illiquidity and performance, that’s more of a symbolic vote of confidence.
13. EduInvesting Verdict™
Shricon Industries feels like a museum piece on BSE—frozen in time, with Q1 FY26 looking more like a rounding error than a quarterly statement.
- Weak revenue
- Operating losses
- No scalable project in sight
- Yet trading at 4.6x Book!
Unless there’s some mega land bank hidden in the fine print or a real estate revival plan not yet disclosed, this one looks like a “real estate developer with no real estate to develop.”
Verdict: Until proven otherwise, Shricon is a valuation black hole orbiting a hope-fueled illusion.
Metadata
– Written by Eduinvesting Team | 23 July 2025
– Tags: Shricon Industries, Real Estate, Microcap, Q1 FY26, Civil Construction, BSE Stocks


