Sharda Motor Q4 & FY26: The ₹1,100 Crore Cash Cushion Facing a 12% Margin Reality Check
Section 1 — At a Glance
The financial narrative of Sharda Motor Industries Ltd (SMIL) in FY26 presents a striking paradox of top-line velocity and operational friction. Headline revenue from operations reached ₹3,396.8 crore, marking a robust 20% year-on-year expansion that highlights stable domestic off-take and volume integration across its structural automotive business. However, a deeper look into the operational anatomy reveals structural pressures; while top-line growth accelerated, consolidated EBITDA margins experienced contraction, compressing from 14.0% in FY25 to 12.3% in FY26.
This operational divergence stems primarily from a shifting mix optics problem, where a sharp escalation in customer-managed catalyst raw material prices inflated revenue without yielding corresponding absolute profitability. Consequently, full-year consolidated Profit After Tax (PAT) arrived at ₹345.4 crore, a 10% increase trailing the top-line expansion rate.
The primary focal point for long-term investors remains the asset side of the balance sheet, where liquid investments and cash equivalents expanded substantially to over ₹987 crore, providing a powerful, unleveraged capital cushion. This massive liquidity reserve grants management exceptional strategic flexibility, even as the core business navigates an ambitious transition toward powertrain-agnostic architectures and capital-intensive global export verticals.
The core tension lies in capital allocation efficiency. Holding nearly 45% of total assets in low-yielding liquid treasuries inevitably depresses overall corporate returns, shifting the investment thesis from simple operational execution to a complex test of asset deployment under tightening environmental mandates.
Section 2 — Introduction
Sharda Motor Industries Ltd stands as an established titan within the Indian automotive component architecture, traditionally anchored to its dominant footprint in passenger and light commercial vehicle emission control systems. Over the past year, the company has actively attempted to rewrite its structural identity, pivoting from a pure-play localized exhaust supplier into a multi-vertical engineered component player.
Through highly targeted capacity adjustments—including the commissioning of its Chakan 3 facility and a capital footprint expansion into Uttarakhand—the group is positioning itself to capture secular domestic architectural shifts under tightening CAFE regulations, while aggressively positioning its newly formed global business vertical to tap into structural supply chain realignments across North America and Europe.
Section 3 — Business Model: WTF Do They Even Do?
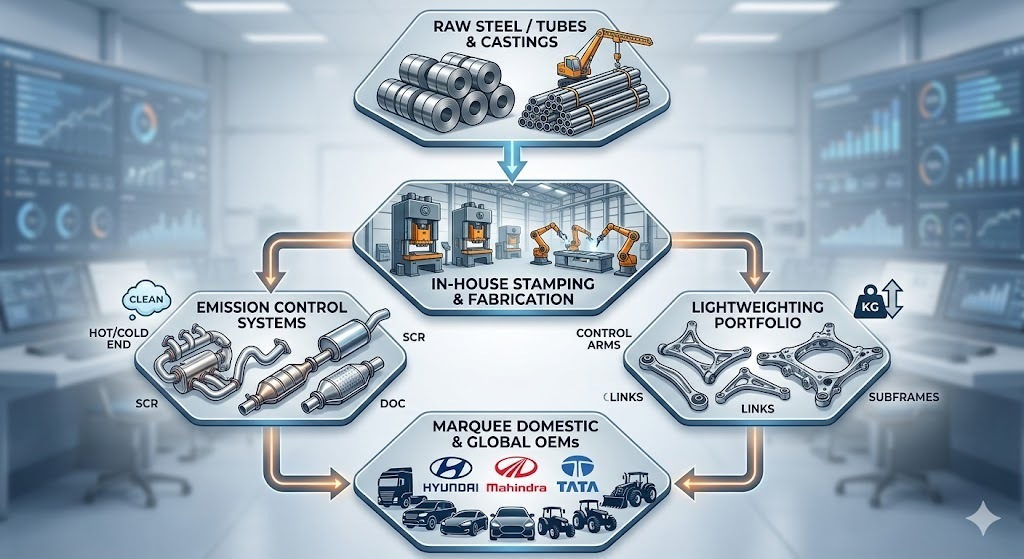
At its core, Sharda Motor operates as the corporate equivalent of an automotive lung specialist. They capture toxic engine exhaust fumes and turn them into compliant, regulated gases before the world catches a whiff. The company controls roughly 30% of the passenger and light commercial vehicle emission market share in India, meaning nearly one in three traditional combustion cars on domestic roads relies on their silencers, catalytic converters, and hot-end components to pass inspection.
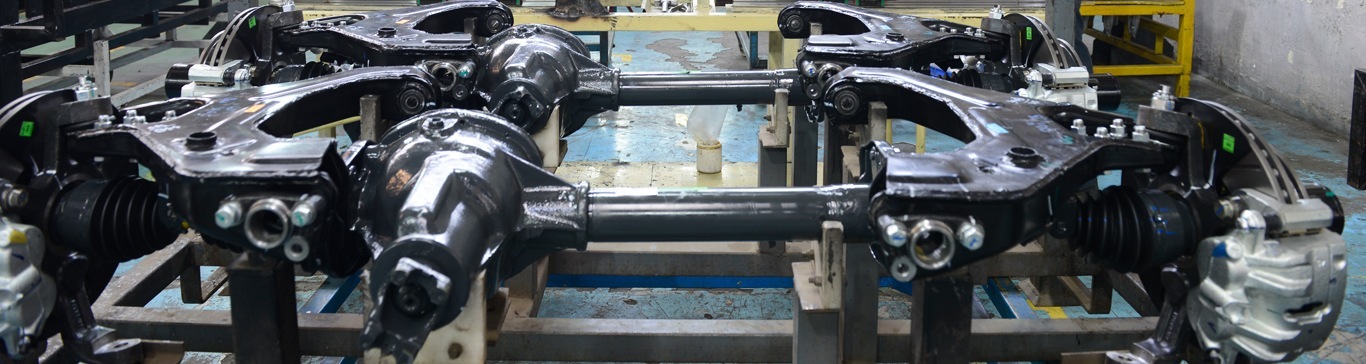
Because relying purely on carbon-producing engines is a risky long-term strategy, management has aggressively scaled its lightweighting business to claim a 14% market share in suspension control arms and links. This structural pivot makes them entirely powertrain-agnostic, meaning whether an OEM manufactures a diesel truck, a hybrid SUV, or a battery-heavy EV, Sharda Motor sells them structural chassis steel to keep the vehicle balanced. The financial catch? Their top two historical customers—Mahindra & Mahindra and Hyundai—command a staggering 71% of total exhaust revenues, creating an intense customer concentration loop where an OEM slowdown can severely pressure their manufacturing lines.
Section 4 — Financials Overview
Figures are consolidated, in ₹ crore.
Quarterly Performance Trend
Metric
Q4 FY26
YoY (%)
QoQ (%)
Revenue from Operations
971.8
29.59%
10.23%
EBITDA / Operating Profit
112.9
12.00%
6.11%
Profit After Tax (PAT)
89.4
6.55%
9.83%
Reported EPS (₹)
15.58
4.99%
9.94%
The top-line jump of nearly 30% YoY in Q4 FY26 looks spectacular on paper until you notice that EBITDA only crawled up by 12%. This disconnect highlights that the company is processing far higher volumes of lower-margin, precious-metal-heavy assemblies where customer-dictated pricing leaves little room for spread expansion. Volatility in gross spreads reminds us that absolute revenue numbers can often distort basic operational realities.
Did Management Walk the Talk?
During previous corporate briefings, management confidently guided toward steady execution in their newly minted suspension and global verticals to offset domestic fluctuations. Looking at the operational data, they delivered on physical execution: the Chakan 3 lightweighting assembly plant hit its Scheduled Commercial Operations Date (SOP) on time, and domestic lightweighting market share successfully climbed to 14%.
However, their big-ticket international catalyst-free export project to North America hit another customer-side snag. Originally planned for early FY26, the SOP has been pushed out again from Q2 FY27 to Q3 FY27 due to transitional inventory build-ups. While management frames this as an outside logistical adjustment, investors must note that international timelines remain highly fluid.
Section 5 — Valuation Discussion: Fair Value Range Only
To evaluate Sharda Motor’s current relative position, we run a comparative assessment using its reported closing market capitalisation of ₹4,841.19 crore and a Current Market Price (CMP) of ₹843.30.
1. Re-calculated P/E Method
Sharda Motor’s full-year FY26 reported consolidated net profit stands at ₹345.42 crore. Based on