SBC Exports Ltd FY26: The Order Book Speaks, The Balance Sheet Screams
General information and entertainment, not investment advice. The author is not a SEBI-registered adviser or research analyst. No recommendation, no promised returns. Markets carry risk including loss of capital. Figures may not be current. Consult a registered adviser before acting.
1. At a Glance
SBC Exports reported FY26 revenue of ₹403.21 crore, up 35% year-on-year. Net profit landed at ₹25.27 crore, up 89% — a far sharper climb than sales.
The compression in numbers is instructive: operating margins stayed at 8.3%, flat to FY25. Operating profit grew 41%, yet net profit grew 89%, meaning the leverage came from below the line — other income of ₹13.72 crore (₹8.99 cr prior year) and a lower effective tax rate carried the day.
The order book (consolidated data via announcements) stands at ₹300+ crore for garments and ₹160 crore for IT services. Q4 sales jumped 35% sequentially to ₹141.6 crore, but net profit fell to ₹8.22 crore from ₹11.2 crore in Q3. The margin compression in the quarter — operating profit halved to 4.2% — is where the tension lives.
The balance sheet borrowed ₹91 crore net in FY26 (borrowings rose from ₹136.27 cr to ₹227.14 cr). Debt-to-equity sits at 2.83 — not alarming for a small garment exporter with repeat orders, but it’s the kind of number that asks a question: does rapid scaling pay back faster than the debt service?
One wisdom line: Order books do not print cash. Working capital does.
2. Introduction
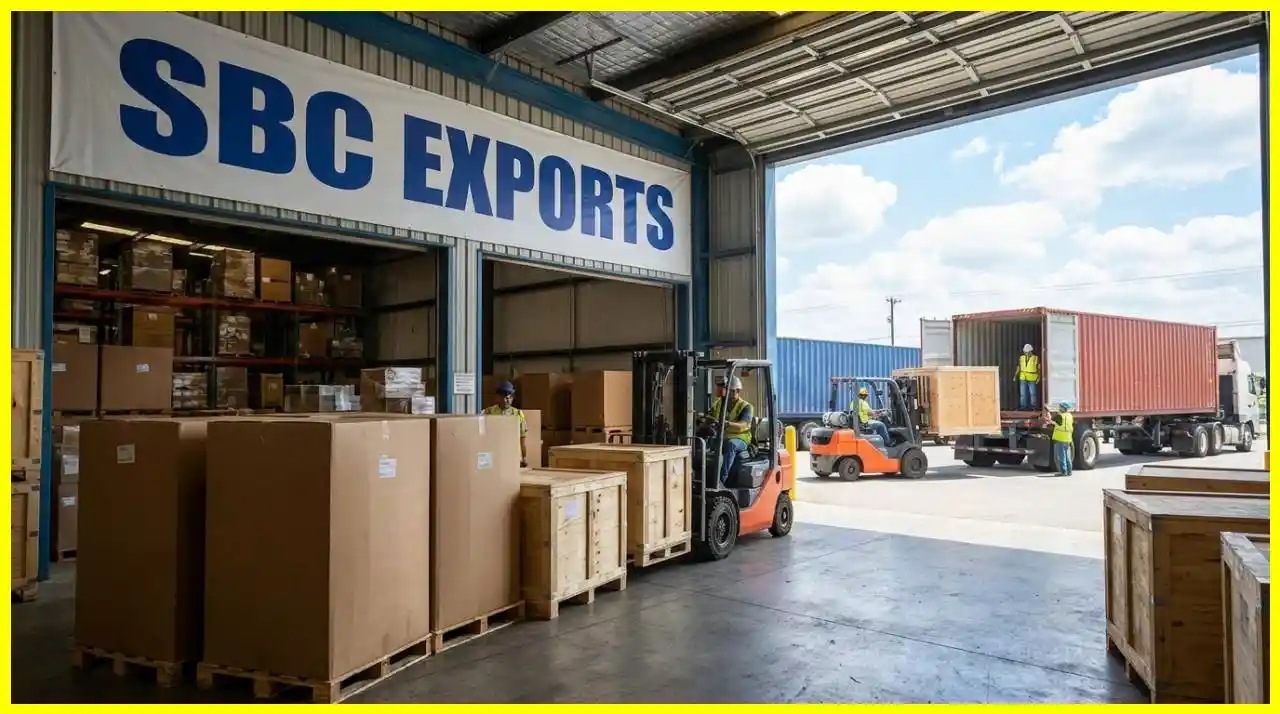
SBC Exports began in 2011 as a handmade carpet trader in Mirzapur. Over 15 years, it has become a three-segment business: garments (manufacturing, exports), IT services (manpower, staffing, e-governance), and travel (the Mauji Trip subsidiary acquired for diversification).
FY26 marked the first full year post-bonus issue (bonus of 1:1 allotted in March 2025). The share count rose from 47.62 crore to 47.62 crore on par — wait, that’s capped. Paid-up capital stayed at ₹47.62 cr. For EPS math, shares used in divisor: roughly 47.62 crore.
Recent moves: F-Route (D2C apparel brand) launched June 2026. Preferential issue (promoter loan conversion) approved May 29, 2026, then stalled by procedural issues June 5. Export orders keep coming — Dubai repeat order (₹45 crore, Nov 2025), IIT Jodhpur contract (₹10.77 crore, Dec 2025), another Dubai order (₹17.56 crore, Aug 2025).
The company is mid-capex: CWIP (capital work-in-progress) stands at ₹15 crore, up from ₹3 crore (FY25). A new ₹18-crore manufacturing unit is under construction in Ghaziabad to expand export capacity.
3. Business Model: WTF Do They Even Do?
The company sprawls across three unrelated verticals.
Garments (57% of FY26 revenue, ₹17.12 crore PAT). SBC manufactures innerwear, leisurewear, comfort wear, shorts, lowers — 120+ SKUs across brands. Export penetration is rising: repeat orders from Gulf-based buyers (HUXXE, Crossways). Domestic: 400+ distributors across 12 states, 25,000+ retail touchpoints, a new F-Route e-commerce platform (launched June 2026 for D2C). Installed capacity: four units totalling ~2.5 million pieces/month (Units 1–4 scattered across Mirzapur and Ghaziabad). The expansion (Unit 5 in Ghaziabad, ₹18 crore) will add another 600,000 pieces/month. Unit economics are compressed: garment margins trend 10% OPM, well below Page Industries (22%) but competitive for a contract/export house.
IT & Manpower Services (34% of revenue, ₹11.24 crore PAT). SBC staff ministries, departments, NIC Services, DRDO — e-governance, HR services, system integration, scanning/digitization, training. Government contracts provide stability but not velocity. Order book for FY26: ₹160 crore, stretched across multi-year engagements. Margins are healthier: IT segment clocked 28% OPM in Q4 (operating profit ₹320 lakh / sales ₹4,016 lakh). But IT is a people business — hiring, attrition, and wage inflation are the hidden taxes on growth.
Travel Services (9% of FY26 revenue, ₹3.51 crore PAT). Mauji Trip (subsidiary, incorporated Dec 2021) manages MICE, ticketing, hotel bookings, ground support. Still small; segment EBITDA is tight. Management flagged an IPO for this subsidiary (May 2025 press release), but no progress public-facing.
The portfolio is a hedge: garments chase exports and margin, IT chases contract stability, travel chases diversification. But they’re three separate supply chains competing for the same cash and management attention.
4. Financials Overview
Figures are consolidated, in ₹ crore.
Metric
Latest Q (Q4 FY26)
YoY
QoQ
Revenue
141.60
+36%
+35%
EBITDA (Operating Profit + D&A)
6.43
+37%
-47%
Net Profit
8.22
+148%
-27%
EPS (Annualised from Q4)
₹0.53
₹0.28
—
Wait on EPS. Q4 is March-ended, the year-end quarter. Q4 actual net profit is ₹8.22 cr. Full-year net profit is ₹25.27 cr. EPS = 25.27 / 47.62 = ₹0.53 (full-year). That matches the filing. Do not multiply Q4 by 4; the full year is done.
FY26 Full Year Snapshot
Metric
FY25
FY26
Change
Revenue
298.53
403.21
+35%
Operating Profit
24.48
33.47
+37%
EBITDA
26.08
35.27
+35%
Net Profit
13.37
25.27
+89%
EPS
₹0.28
₹0.53
+89%
Remarkable: profit nearly doubled while revenue grew 35%. The divergence has three causes.
Other income surged to ₹13.72 crore (FY25: ₹8.99 cr). The press release and filings don’t itemise this clearly, but in prior years other income has included interest on deposits and possibly currency gains on exports. A ₹4.73 crore swing is material and non-recurring in character.
Interest expense rose sharply to ₹11.1 crore (FY25: ₹7.76 cr), +43%. Debt grew ₹91 crore. Yet net profit still expanded — because PBT (profit before tax) jumped to ₹34.25 crore from ₹18.36 crore, a 86% leap. The tax rate fell to 26% (FY25: 27%).
Concall & Management Commentary (Not available in docs provided; we rely on filing data.)
The FY26 results note no exceptional items. The company is “in the process of assessing” impact of new Labour Codes (Nov 2025 notification) but foresees “no material impact.” A red flag watch, not a red flag yet.
5. Market Expectations & Historical Multiples
This section describes how the market is currently pricing the company and how that compares with its own history and peer group. It is descriptive, not predictive.
Metric
Current (at ₹37.58)
5-Yr Average
Peer Median
P/E
70.87
~50.80
22.22
EV/EBITDA
50.92
—
~23.00
P/B
22.30
—
2.17
ROE (LTM)
37.2%
26.9%
11.4%
ROCE (LTM)
18.2%
~20%
13.7%
The market pays 70.87x earnings here versus a peer median of 22x. At the 5-year average multiple of ~51x, the arithmetic produces