Search for Stocks /

Polo Queen Industrial and Fintech: FY2026 — 202x P/E on 1.3% Returns

Spotted a factual error — a wrong number, date, or fact? Tell us and we will check the source.

General information and entertainment, not investment advice. The author is not a SEBI-registered adviser or research analyst. No recommendation, no promised returns. Markets carry risk including loss of capital. Figures may not be current. Consult a registered adviser before acting.


1. At a Glance

The market is pricing Polo Queen at ₹15.48 — a P/E of 202x against a FY2026 EPS of ₹0.0765. That framing alone signals the central tension: a ₹520 Cr market cap on ₹2.57 Cr annual profit, with ROE at 1.3% and ROCE at 1.8%.

Sales dipped 5.4% year-on-year to ₹75.86 Cr in FY2026. The company holds net cash of ₹183 Cr against that market cap — a tidy balance sheet propping up what would otherwise be a loss-making equity.

Margins are paper-thin: OPM sits at 5.6%, and only ₹2.57 Cr filtered down to the bottom line. The latest quarter (Mar 2026) saw sales jump 27.9%, but profit collapsed 56% — the revenue gain evaporated in execution.

Shareholding is locked: promoters own 74.88%. The rest is public, fragmented.

Reader question: Can a cash pile rescue an asset base that earns almost nothing, or just delay the reckoning?


2. Introduction

Polo Queen spun off from a trading family in 1984. The company trades in fabrics, FMCG (personal, home, kitchen, and fabric care under the Poloqueen brand), minerals, and chemicals across Maharashtra and neighboring states. It also holds a non-banking finance arm (Polo Queen Capital Ltd) that requires ongoing equity infusions and a data centre venture parked in subsidiary status.

The business model straddles old and new: legacy trading operations (thin margins, high turnover) alongside fintech registration and infrastructure plays (all capital-heavy, pre-revenue). This split personality has made guidance unreliable. The company pledged a ₹2,500 Cr mega-project in 2023 — an agro-processing and pharma facility at Mahad. It has not materialized. A data centre JV remains in proposal stage.

The stock, formerly ₹2/share face value, split 5-for-1 in 2020. It peaked at ₹64.70 in the boom and has fallen to ₹15.48 — a 76% drawdown over a year.

Recent months brought regulatory friction: SEBI conducted a search for alleged stock price manipulation in March 2025. The company denies wrongdoing but the incident sits in the public record.


3. Business Model: WTF Do They Even Do?

Polo Queen is a jack-of-all-trades: FMCG production and distribution, chemical and mineral trading, defence supplies, IT-park development, NBFC operations, and proposed pharma manufacturing.

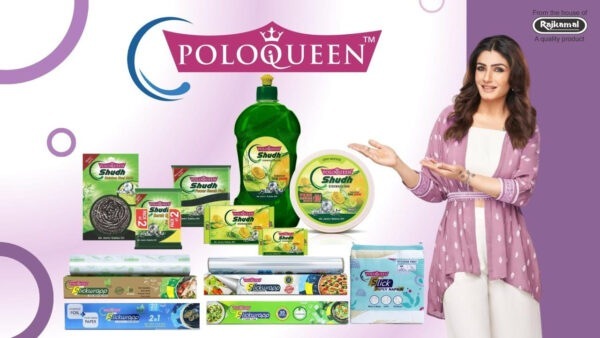
The FMCG arm manufactures and sells personal care (soaps, hand wash), home care (mosquito coils, cleaners, air fresheners), kitchen care (Poloqueen Shudh dishwash), and fabric care (detergent, soap, whiteners) under the Poloqueen brand. This is a low-barrier, high-competition segment dominated by unorganized players and mega-brands like ITC, Unilever, and Marico. Poloqueen’s tier-II and tier-III focus in Maharashtra is a niche, but also a constraint: distribution power, brand recall, and pricing power are all modest.

Trading operations in chemicals and minerals are even thinner-margin. The company buys and resells commodity inputs to foundries, textile mills, and pharmaceutical manufacturers. Revenue volatility is high; pricing is set by spot markets; the customer base is cyclical.

The NBFC subsidiary (Polo Queen Capital Ltd) sits under RBI registration but has been loss-making. The data centre play at MIDC Dombivli is architectural but unbuilt. The agro-pharma project at Mahad (₹2,500 Cr ambition) has seen zero capex.

The roast: A company pretending to be diversified but doing none of its segments well enough to generate scale, profitability, or competitive moat. It is a trading house with a manufacturing appendix, not the other way around.

4. Financials Overview

Figures are consolidated, in ₹ crore.

MetricFY2026FY2025FY2024FY2023
Revenue75.8680.1768.4476.75
EBITDA4.264.473.555.48
PAT2.572.642.872.36
EPS0.07650.07860.08540.0703

Revenue has swung wildly. The company posted ₹80.17 Cr in FY2025, dipped to ₹75.86 Cr in FY2026 — a decline of ₹4.3 Cr or 5.4%. The latest quarter (Mar 2026) saw sales of ₹21.31 Cr, up 27.9% from ₹16.66 Cr in Q4 FY2025. The quarterly jump masks an annual retreat.

PAT has also shrunk slightly, from ₹2.64 Cr (FY2025) to ₹2.57 Cr (FY2026). The tax rate averaged 28.6% in FY2026. EBITDA of ₹4.26 Cr reflects an operating profit margin of 5.6% — respectable for trading, bare for FMCG.

The whisper: Sales growth has flatlined (3-year CAGR: 0.39%). Profit has stalled (3-year CAGR: 3.17%). The company is marking time, not moving.

In Q4 FY2026, net profit collapsed to ₹0.34 Cr from ₹0.78 Cr in Q4 FY2025 — a 56% plunge despite sales rising 28%. This suggests either a one-time cost hit, adverse product mix, or operational slippage. The company has not provided management commentary (no concall transcript available for this quarter).


5. Market Expectations & Historical Multiples

This section describes how the market is currently pricing the company and how that compares with its own history and peer group. It is descriptive, not predictive.

MetricCurrent5-Year AveragePeer Median
P/E202.26x49.0x23.09x
EV/EBITDA100.0x
ROE1.34%1.08%5.23%
ROCE2.48%6.21%

The market currently pays 202x earnings here, against a 5-year peer median of 23x. At the peer median multiple, the arithmetic outputs ₹1,767 Cr from annualised FY2026 EPS, or ₹52.6 per share.

The company’s own 5-year P/E average is 49x — still a fraction of today’s 202x. ROE has hovered near 1% for five years; the peer median is 5.23%. ROCE sits at 2.48% here versus a peer median of 6.21%.

The market appears to be pricing in either a dramatic operational turnaround (new revenue from the Mahad project, the data centre, or NBFC scale-up), a strategic takeover, or illiquidity premium driven by promoter control. None of these narratives carry visible momentum.

The valuation sits well above both the company’s own history and the peer set on every visible metric.


6. What’s Cooking

The agro-pharma and data centre projects remain unfinalized. The company has earmarked funding, not deployed it. SEBI’s March 2025 search for price manipulation is under investigation — no findings public yet. The NBFC subsidiary requires ₹5 Cr additional investment over FY2026–27 to meet RBI’s net-owned-funds requirement. Auditor Kava & Associates resigned in August 2024; a successor was appointed. The company reported BSE and MSEI exchange fines of ₹80,240 and ₹59,000 (Nov 2025) for alleged compliance lapses, which it disputes. Promoter shareholding has fractured slightly (74.88% in Mar 2026 from 74.92% a quarter prior), driven by transfers within the Sanghai family. METRO Cash & Carry remains the distribution tie-up for FMCG. Tier-II and Tier-III city focus persists.


7. Balance Sheet

ItemFY2023FY2025FY2026
Total Assets218.83217.94222.80
Net Worth118.93 + 67.15 = 186.08190.81193.37
Borrowings14.2410.8610.05
Other Liabilities18.5116.2719.38

Assets = Liabilities check: ✓ (222.80 = 193.37 + 10.05 + 19.38).

The balance sheet is a fortress: debt is almost nonexistent (D/E = 0.052x). Net worth has accreted steadily from reserves. Fixed assets dominate (₹183 Cr of net block), mostly frozen real estate and plant at MIDC Dombivli.

Three bullets at the balance sheet:

  • A ₹183 Cr net block earning next-to-nothing: Return on Fixed Assets is roughly 1.4%. The asset base is too large relative to the revenue stream.
  • Net cash of ₹183 Cr (borrowings subtracted from net worth) against a ₹520 Cr market cap. The equity is being valued at 2.84x its tangible net position.
  • Other liabilities have jumped to ₹19.38 Cr from ₹16.27 Cr. This includes payables to related parties and contingent liabilities that warrant scrutiny.

Wisdom line: A fortress with nothing to defend — capital sufficiency without capital efficiency.


8. Cash Flow: Sab Number Game Hai

YearOperating CFInvesting CFFinancing CF
FY20244.40-3.10-1.04
FY20252.500.15-2.90
FY20262.55-2.09-0.66

Operating cash flow has flatlined at ₹2.5–2.6 Cr annually. Free cash flow (operating CF minus capex) is ₹0.46 Cr in FY2026 (₹2.55 Cr – ₹2.09 Cr investing outflow). The company is not self-sustaining from operations; it is burning cash from the balance sheet to fund NBFC infusions and speculative projects.

Investing outflows have averaged ₹1.7 Cr over three years. This is primarily the NBFC subsidiary injection and the data centre feasibility spend. Financing outflows reflect debt reduction (steady repayment) and no dividend payout.

Wisdom line: The balance sheet is doing the talking. Operations generate just enough to service interest and stave off equity dilution. Growth capex is on life-support.


9. Ratios: Sexy or Stressy?

RatioValue
ROE1.34%
ROCE2.48%
P/E202.26x
PAT Margin3.39%
D/E0.052x

ROE at 1.34% — the equity is working part-time. A net worth of ₹193.37 Cr is generating ₹2.57 Cr of annual profit. The cost of capital on that equity is easily 8–10%; the company is destroying shareholder value on a cost-of-capital basis.

ROCE at 2.48% compounds the problem. Incremental rupees deployed return just 2.48 paise. The standard playbook for a company at this ROCE is capex withdrawal and cash repatriation; instead, cash flows toward NBFC infusions.

P/E at 202x is an outlier in the peer set (median 23x). No growth narrative justifies this multiple unless management unveils a transformational event — and there is no visibility on that front.

PAT margin of 3.39% reflects the hazards of trading: low pricing power and high cost of goods sold. Fabric and chemicals move at commodity spreads.

D/E at 0.052x is pristine, but it is pristine by default. The company has no borrowing capacity to fund anything meaningful; it has exhausted balance sheet reserves.


10. P&L Breakdown: Show Me the Money

YearRevenueEBITDAPAT
FY202468.443.552.87
FY202580.174.472.64
FY202675.864.262.57

Revenue peaked in FY2025 at ₹80.17 Cr and has retreated. The company lost ₹4.3 Cr of sales in one year — a 5.4% contraction. EBITDA has also declined, from ₹4.47 Cr to ₹4.26 Cr.

Profitability has been flat. PAT has inched down from ₹2.87 Cr (FY2024) to ₹2.57 Cr (FY2026). At a 3-year profit CAGR of 3.17%, the business is stalled.

The trajectory is horizontal, not accelerating. The company is not expanding; it is grinding.


11. Peer Comparison

CompanyRevenue (₹ Cr)PAT (₹ Cr)P/E
Redington119,1621,59411.46x
MSTC37021818.15x
Vintage Coffee5537232.45x
Creative Newtech2,7057014.97x
Polo Queen762.57202.24x
Peer Median1859.5123.09x

Polo Queen is the smallest in the peer set by revenue (₹76 Cr) and profit (₹2.57 Cr). Redington trades 1,565x larger by revenue; MSTC trades 4.9x larger. The peer median P/E is 23x; Polo Queen is 202x the peer median on earnings.

Even within the trading and distribution category, the company is a minnow paying a shark’s price. Redington, the peer behemoth, trades at 11.46x with an ROE of 16.89%; Polo Queen trades at 202x with an ROE of 1.34%.

Twice the peer multiple on half the margin — that phrase does not capture the gap. This is a different order of magnitude altogether.


12. Miscellaneous: Shareholding & Promoters

Category%
Promoters74.88
Public25.12
DII0.00
FII0.00

The Sanghai family — a trading dynasty since 1984 — owns 74.88%. Aneetha Prabhas Sanghai, Prabhadevi Sanghai, Manjuladevi Sanghai, and Vasudha Rahul Sanghai are the primary holders. A recent reshuffle (Mar 2025–Jun 2025) consolidated holdings; some family members exited the top-20 list.

Pan Emami Cosmed owns 11.26% (a large institutional investor in the FMCG space). Kanodia Capital and East India Securities account for 2.98% and 1.65% respectively. The rest is retail.

A small roast on promoters: Four decades of trading acumen, but zero exit strategy or capex clarity. The ₹2,500 Cr mega-project remains architectural. The data centre and NBFC ventures are capital-drains without revenue. The stock has fallen 76% in one year. A promoter who owns three-quarters of a business and holds a frozen asset base has signaled no defined path forward — just reactive operations against past commitments.


13. Corporate Governance: Angels or Devils?

Auditors: Kava & Associates (statutory) resigned in August 2024. Successors were appointed. The departure is unexceptional for a small-cap but signals no red flag.

Board: Majority independent directors; standard composition for a BSE-listed entity.

Pledges: None. The promoter is not leveraging stock as collateral — a positive signal.

Related-party transactions: Present but within scale (NBFC infusions, IT-park development). No material off-book related-party debt noted.

Resignations: One whole-time director transition in Sep 2025 (re-designations within the family). No material departures outside the expected cycle.

Tax demands: None reported. The company has maintained compliance through the review period.

SEBI search (March 2025): Alleged price manipulation. The company denies. Investigation status is unclear. This is a material regulatory uncertainty currently unresolved.


14. Industry Roast & Macro Context

The FMCG space in Tier-II and Tier-III cities is a bloodbath. Unorganized production dominates. ITC, Marico, and others have saturation-proof distribution and brand moats. Poloqueen has neither. It relies on METRO Cash & Carry for reach and competes on price — a no-win formula. Margins compress annually as organized retail encroaches.

The trading business (fabrics, chemicals, minerals) is a commodity game. No supplier power, no customer loyalty, no pricing advantage. Spreads hover at 3–5%. The only edge is operational agility and speed; neither is visible in Poloqueen’s numbers.

Distribution in Maharashtra is dense; the state’s industrial base is mature but not growing. Export-led growth (chemicals to pharma, minerals to foundries) would require capex and supply-chain risk that Poloqueen has not taken. It remains domestic, local, and static.

Macro tailwinds for FMCG are present (rising rural incomes, premiumization), but Poloqueen is priced out of the move. It competes where margins are thinnest and capex is highest.


15. EduInvesting Verdict

StrengthsWeaknesses
Debt-free balance sheet; net cash of ₹183 CrROE at 1.34%; ROCE at 2.48%; no shareholder value creation
Promoter ownership at 74.88% ensures alignmentMulti-year project delays; ₹2,500 Cr mega-project remains unbuilt
Four-decade operational history in tradingSales declining (5.4% YoY); profit stalled; margins paper-thin
NBFC and data centre licenses/plans in placeNBFC is loss-making; data centre is vapor; capex has not commenced
OpportunitiesThreats
NBFC scale if profitability achievedSEBI investigation for alleged price manipulation (outcome pending)
Data centre demand in Mumbai if JV materializesCommodity downturn; FMCG competition intensifies
Pharma plant capex if Mahad project fundedPromoter liquidation or forced restructuring if returns deteriorate further

A balance sheet with nothing to hide, a multiple with everything to prove.


Prices referenced are not live. Data as of June 12, 2026. Figures are consolidated in ₹ crore unless stated. EPS and P/E calculations based on full-year FY2026 results; Q4 is annualized where indicated.

Leave a Reply