1. At a Glance – Saree Business, Wedding Season, and a Sudden Cold Shower
At ₹62.7 per share, Saraswati Saree Depot Ltd sits at a market cap of ₹248 crore, trading at a P/E of 9.16 and Price-to-Book of 1.32. Dividend yield? A spicy 3.62%. ROE? 25.2%. ROCE? 28.6%. On paper, this looks like the disciplined cousin in a reckless apparel family.
But wait.
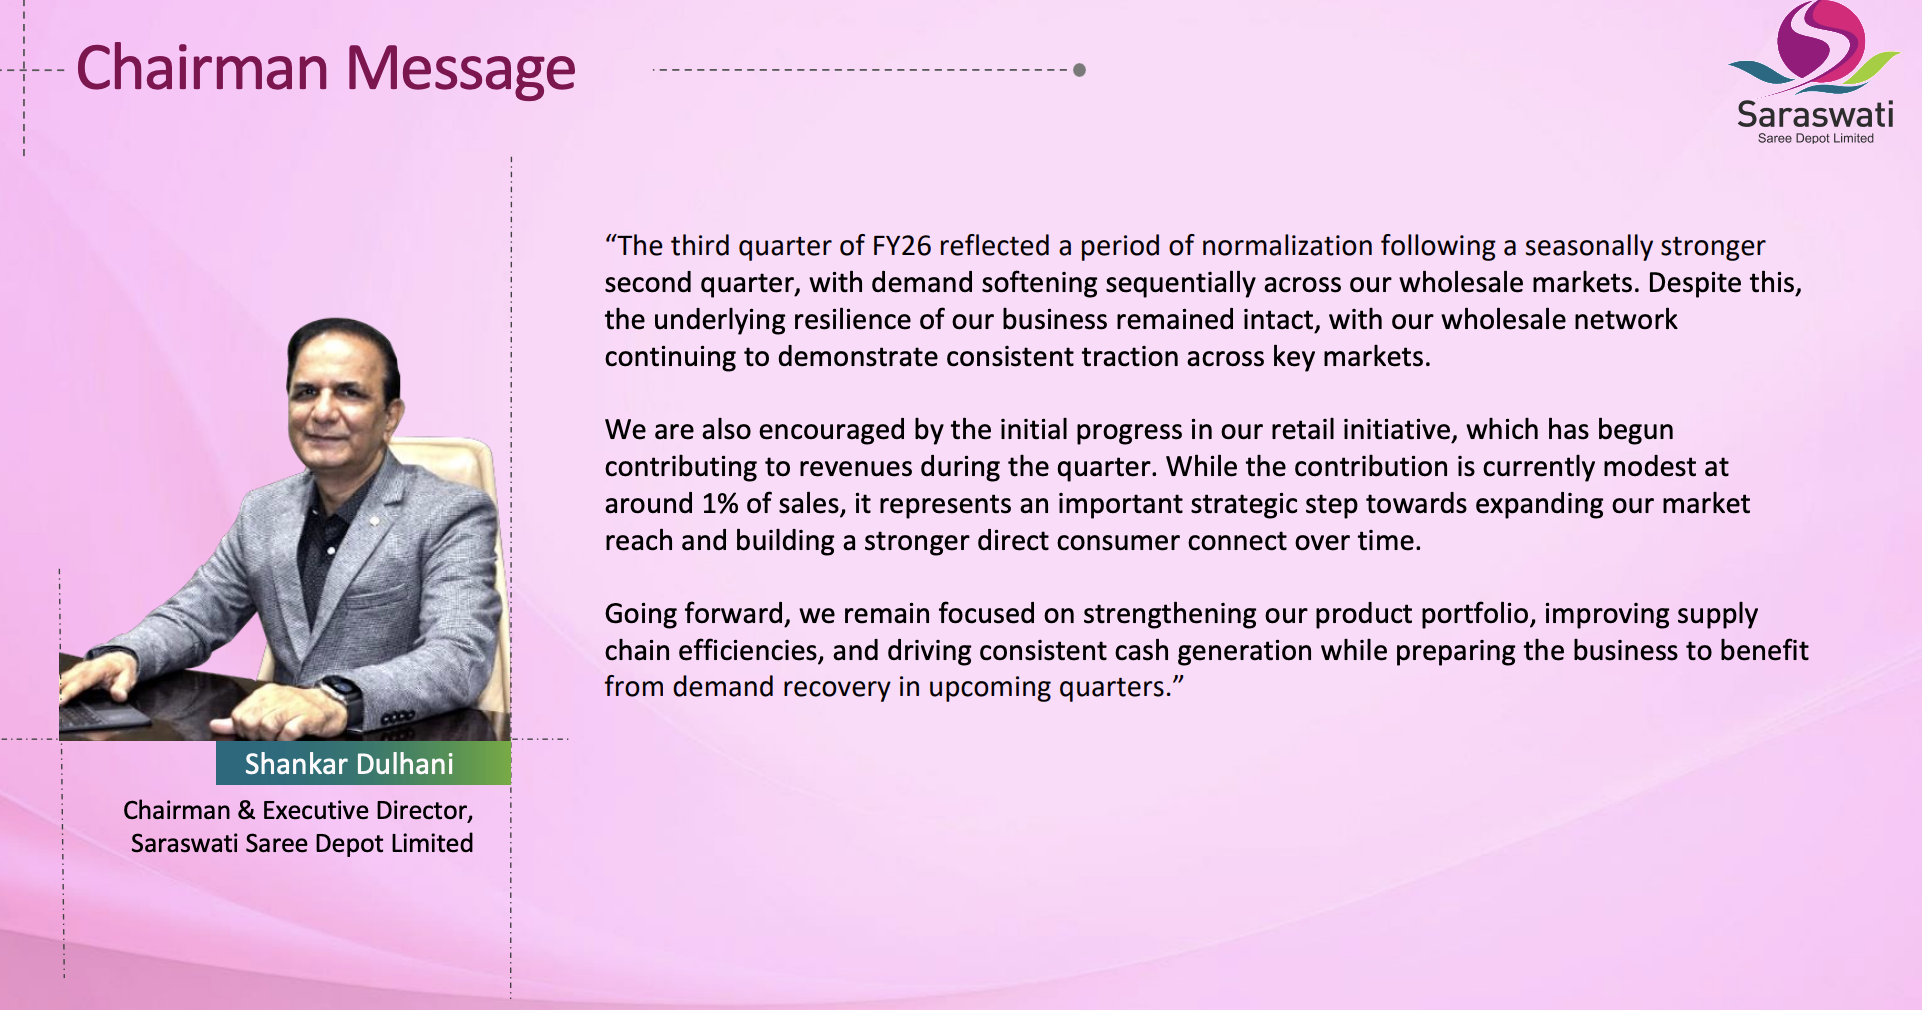
Q3 FY26 revenue dropped 20.7% YoY to ₹144.47 crore. PAT fell 59% to ₹3.21 crore. EBITDA margin shrank from 7.04% to 3.29%.
And the stock? Down 22.8% in 3 months and 37.8% in one year.
So what happened? Did India stop wearing sarees? Did weddings get cancelled? Or is this just seasonality playing villain?
The company says Q3 normalized after a strong festive Q2. Retail has just started contributing (1% of revenue). Wedding season tailwinds expected in Q4.
Low P/E. Strong ROE. Debt almost zero. Margins wobbling.
Is this a temporary lehenga malfunction or a stitching issue in the business model?
Let’s open the saree fold layer by layer.
2. Introduction – From Wholesale Sarees to Public Markets
Saraswati Saree Depot (SSD) is not your Instagram boutique brand. It is a B2B saree wholesaler supplying to over 13,601 customers across India.
Founded in 1996, but promoters have been in the saree business since 1966. This is a multi-generation Dulhani empire.
They operate massive wholesale stores in:
- Kolhapur
- Ulhasnagar
- Ahmednagar
Total space: 235,000+ sq ft
SKU count: 300,000+
They source from 900+ weavers across hubs like:
- Surat
- Varanasi
- Madurai
- Dharmavaram
- Kolkata
- Bengaluru
In FY25:
- Units sold: 1.65 crore
- Revenue: ₹613.61 crore
- PAT: ₹30.57 crore
Sounds stable, right?
But here’s the catch: This is a low-margin, high-volume trading business. OPM is just 5.83%. Net margin around 5%.
One bad quarter of weak demand and margins get squeezed like a saree in a suitcase.
So the real question is:
Is this business cyclical… or structurally thin?
3. Business Model – WTF Do They Even Do?
Imagine Asia’s largest saree supermarket.
That’s SSD.
Step 1:
Procurement team identifies weavers.
Step 2:
Samples made.
Step 3:
Quality check.
Step 4:
Bulk order placed.
Step 5:
Goods dispatched to stores.
Step 6:
Retailers (their customers) come, buy in bulk, and sell to end consumers.
They don’t manufacture.
They aggregate, curate, and distribute.
Revenue mix FY25: