Search for Stocks /

R M Drip & Sprinklers FY26: Revenue Exploded, But the Cash Ran

Spotted a factual error — a wrong number, date, or fact? Tell us and we will check the source.

General information and entertainment, not investment advice. The author is not a SEBI-registered adviser or research analyst. No recommendation, no promised returns. Markets carry risk including loss of capital. Figures may not be current. Consult a registered adviser before acting.


1. At a Glance

Revenue more than tripled in five years. The headline number: ₹197 Cr in FY26, up 51% year-on-year from ₹130 Cr.

But here’s the tension: cash from operations turned negative. The company burned ₹11.4 Cr in FY26—worse than the ₹22.4 Cr drain in FY25. Growing fast looks great on a pitch deck. Growing while bleeding cash raises a question.

The margins stayed solid—operating margin held at 26.5% in FY26 against 27% in FY25. Profit after tax was ₹35.2 Cr. The market is pricing this at ₹19.3 per share, which values the entire business at ₹826 Cr.

A 5:7 bonus was issued in April 2026. The company acquired a pipe-making subsidiary (Brahmanand Pipes) in January for expansion. Debt climbed—borrowings jumped to ₹52.8 Cr from ₹25.5 Cr a year earlier.

All this growth and all this cash burn: what’s the real story?


2. Introduction

R M Drip & Sprinklers Systems began in 1996 as a partnership shop making micro-irrigation gear. The business manufactures drip systems, sprinklers, pipes, filters, and fertigation equipment.

In January 2026, the company acquired Brahmanand Pipes—a move to backward-integrate and add capacity. Construction of the new plant was set to start in Q1 FY27, with commercial production expected by Q2 FY27. This 50,000 sq. ft. phase-one facility would add ₹12,000 MT of annual capacity on top of the existing 22,000 MT.

The board approved a 3% dividend payout for FY26 (₹0.75 Cr spent on dividends in FY26). That’s 2% of net profit—cautious shareholder returns from a growth-focused company.

In April 2026, the board allotted bonus shares in a 5:7 ratio, diluting existing shareholders but keeping capital light and dealer-friendly. The company also installed a 2.2 MW solar plant, expected to save ₹3 Cr annually from Q1 FY27 onwards.


3. Business Model: WTF Do They Even Do?

The company sells irrigation systems—drip and sprinkler equipment, mainly. It also manufactures HDPE and PVC pipes, filters, fertigation gear, and mulch films.

Revenue split in 9M FY26 shows the diversification: micro irrigation accounted for 54.5% of sales, pressure pipes (institutional) 14.5%, single-use drip & sprinklers 9.5%, polymer compounds 10.5%, and agriculture pipes 11%. A year earlier, micro irrigation was 75% of the mix. The company is genuinely broadening out.

The dealer network has exploded. As of 9M FY26, the company had 1,000+ dealers spread across 12 states (Maharashtra, MP, Gujarat, Karnataka, UP, Bihar, Jharkhand, and others). In FY24, it had 300 dealers in 5 states. This ~67% jump in dealer count in less than two years is real distribution leverage.

The company also runs a new IoT-based smart irrigation automation segment launched in partnership with Godrej Agrovet. This tied up across 25 Godrej stores to cross-sell micro irrigation products. Expected to contribute ~5% of revenue by FY27, with 30%+ growth from FY27 onwards.

Manufacturing sits at a 6-acre facility in Nashik with 1,25,000 sq. ft. of space. Installed capacity was 22,000 MT per annum in 9M FY26, running at ~90% utilization. With the new Brahmanand facility, that would jump to 34,000 MT by Q1 FY27.

The model is simple: manufacture low-cost, high-margin irrigation gear in India, sell it through a sprawling dealer network to price-conscious farmers, and now add software and services on top. The subsidy environment (PMKSY pays 45–55% of farmer costs) keeps demand hot.


4. Financials Overview

Figures are consolidated, in ₹ crore.

MetricFY26FY25YoY
Revenue197.4130.3+51.5%
EBITDA51.935.2+47.4%
PAT35.223.9+47.2%
EPS (annualised)0.820.56+46.4%

Earnings per share used full-year FY26 EPS (0.82 for the year) since FY26 is the complete fiscal year, not an interim period. Net profit was ₹35.2 Cr on ₹197.4 Cr revenue, yielding a PAT margin of 17.9%.

EBITDA worked out to ₹51.9 Cr, a margin of 26.3% (calculated from net profit + tax + interest + depreciation).

Capex was aggressive. Capital expenditure in FY26 came to ₹54.9 Cr (purchase of PPE and CWIP). Against that, free cash flow turned deeply negative: operating cash flow was ₹-11.4 Cr, and after capex, free cash flow landed at ₹-66.3 Cr.

The squeeze: the company is buying capacity (new facility, solar, machinery) while also funding a working capital explosion. Trade receivables jumped from ₹107.9 Cr to ₹135.2 Cr—a ₹27.3 Cr increase in just one year.


5. Market Expectations & Historical Multiples

This section describes how the market is currently pricing the company and how that compares with its own history and peer group. It is descriptive, not predictive.

MetricCurrentHistorical Average (5Y)Peer Median
P/E23.412.120.3
EV/EBITDA16.118.216.2
ROE36.9%30.6%24.5%
ROCE37.9%22.0%18.4%

The market currently pays 23.4x earnings here, compared to a peer median of 20.3x. Against its own 5-year average of 12.1x, the multiple has re-rated sharply.

EV/EBITDA sits at 16.1x versus the peer set at 16.2x—in line. But the company’s ROE (36.9%) and ROCE (37.9%) are well above the peer median (24.5% and 18.4%), suggesting the market is pricing in sustained high returns.

The company appears to be priced for growth. Revisions have been positive (51% revenue growth, 47% profit growth in FY26 alone). The multiple expansion signals the market is betting that strong ROCE and capex investments will drive future earnings per share higher, even as immediate cash generation remains weak.

6. What’s Cooking

Acquisition of Brahmanand Pipes. The company closed the 100% acquisition of Brahmanand Pipes Private Limited in January 2026 for ₹1 Cr. This brought a brownfield facility near Sinnar with land for a 12,000 MT per annum capacity plant. Phase 1 (50,000 sq. ft., 12,000 MT capacity) was slated for Q1 FY27 commencement, with production by Q2 FY27. This adds ₹3 Cr of expected capex over the next two years and dilutes some near-term free cash flow.

MoU with Maharashtra Government. Subsidiary Brahmanand Pipes signed a Memorandum of Understanding with the Government of Maharashtra on 6 May 2026 for a ₹100 Cr investment in the expansion phase. This is aspirational at best—MOUs rarely translate dollar-for-dollar—but the state backing shows policy support.

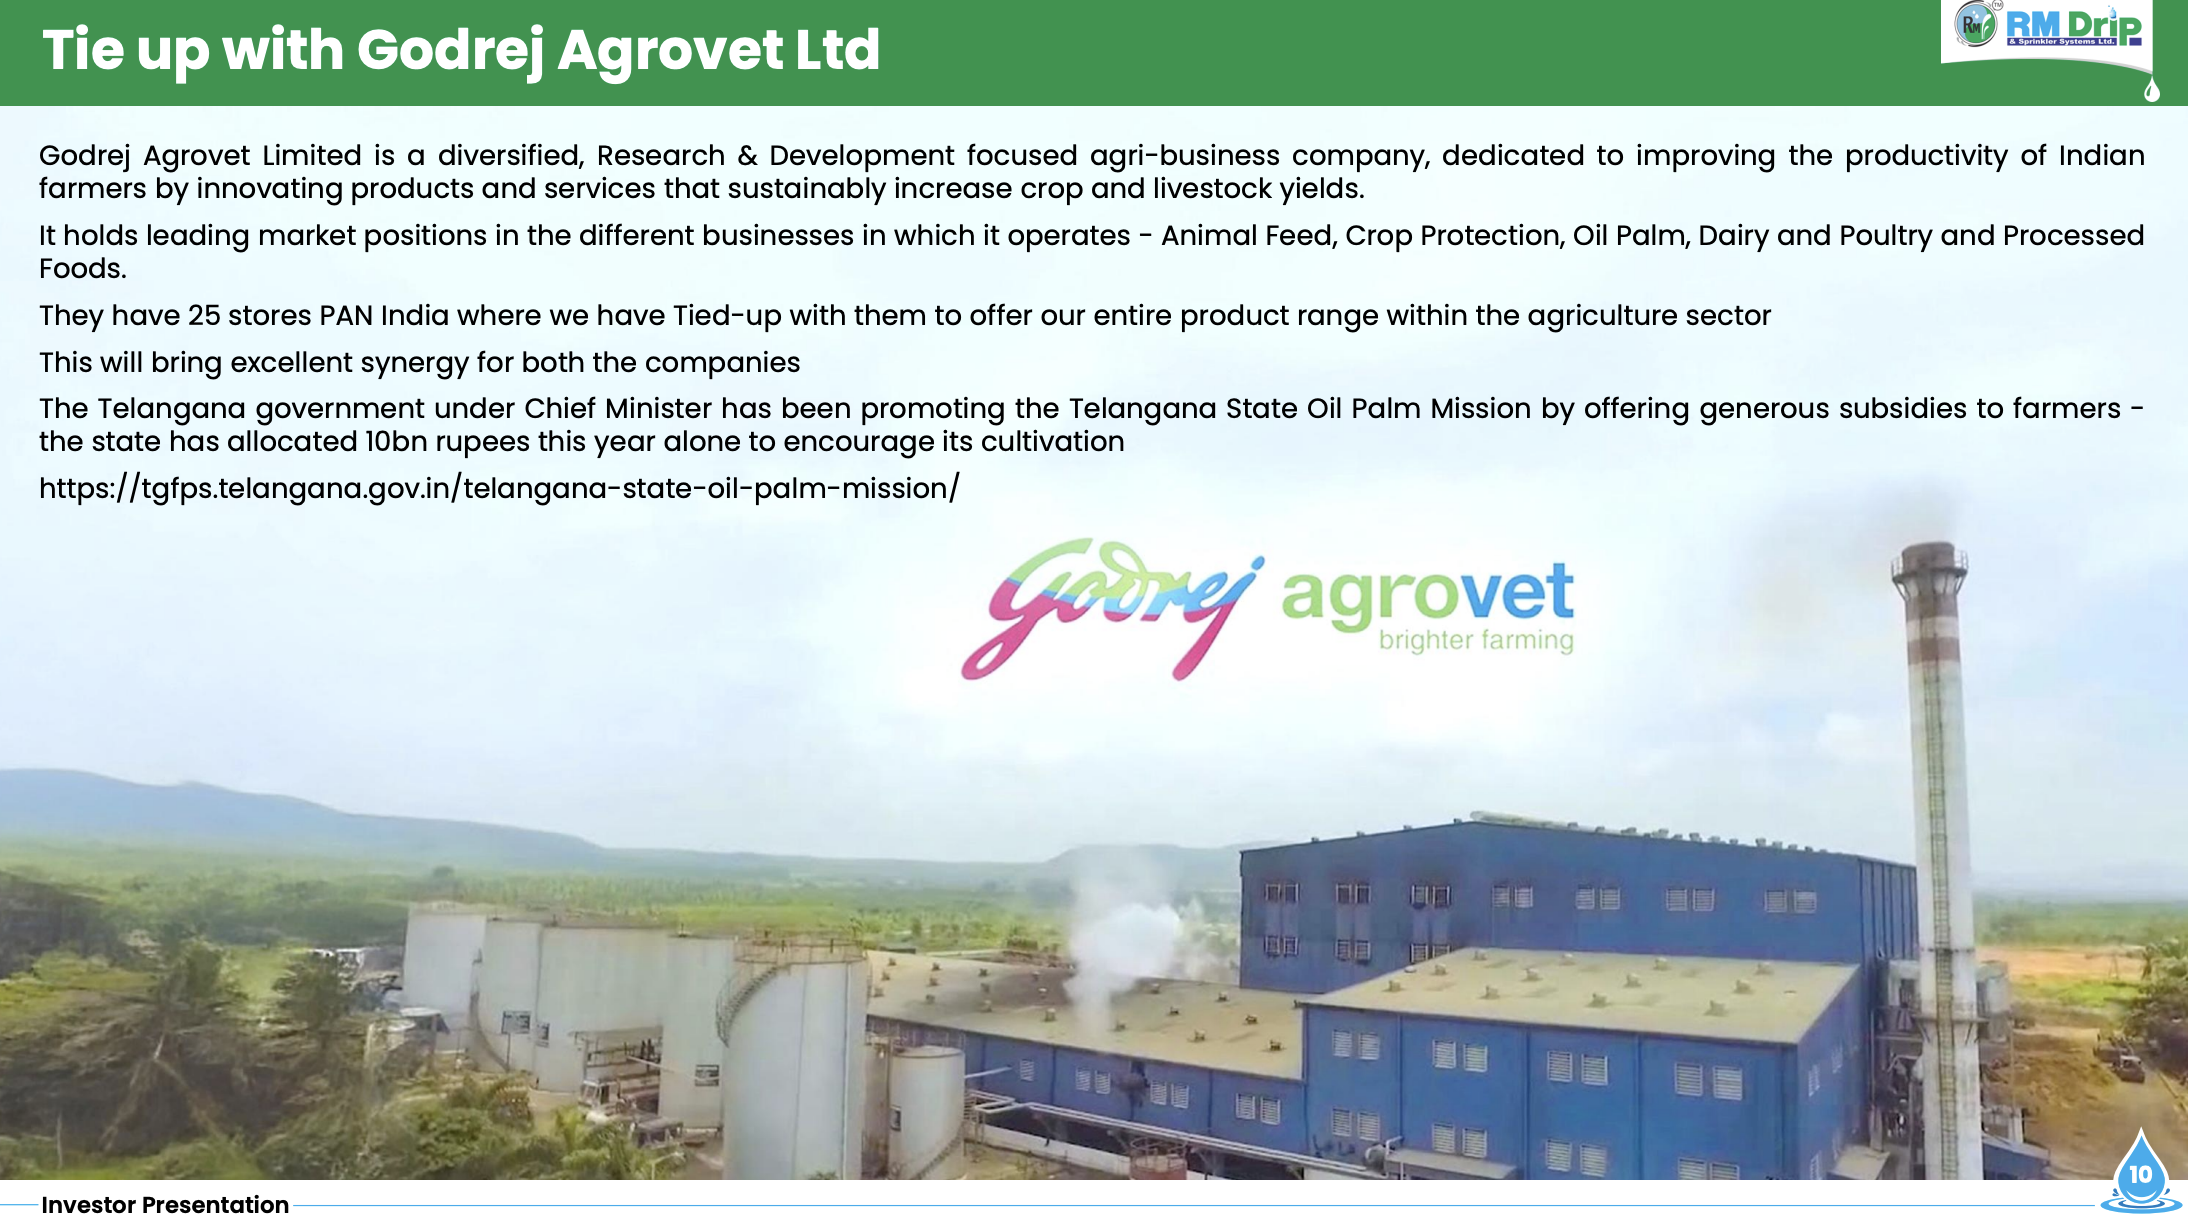
Strategic Partnership with Godrej Agrovet. In February 2026, the company tied up with Godrej Agrovet Limited to distribute its entire product portfolio across 25 stores pan-India. Godrej is a diversified agri-business (animal feed, crop protection, oil palm) with deep farmer reach. The deal unlocks cross-selling to Godrej’s existing farmer base, reducing RM Drip’s dependence on its own dealer network for some segments.

IoT Smart Irrigation Launch. The company is launching an integrated IoT-based smart irrigation automation platform in partnership with an undisclosed technology vendor. Expected to contribute ~5% of revenue by FY27 and grow at ~30% from FY27 onwards. This is software/hardware integration—higher margin, higher stickiness.

Bonus Issue. A 5:7 bonus (17.84 Cr shares allotted) was approved in April 2026. This dilutes EPS mechanically but keeps the share capital lean—useful for share-based compensation, dealer incentives, or future capital raises.

Capacity Expansion Ramp. The company is on an aggressive capex cycle: ₹54.9 Cr in FY26, with plans to reach 34,000 MT capacity by Q1 FY27 (up from 22,000 MT). This assumes no delays in Brahmanand construction and means capex will stay elevated through FY27.

Dealer Network Scaling. From 300 dealers in FY24 to 1,000 dealers in 9M FY26—a 3x jump in 18 months. The company is targeting 2,000 dealers by FY30. This scales revenue but also working capital: more dealers = more inventory in the pipeline, more debtors, longer collection cycles.


7. Balance Sheet

ItemFY24FY25FY26
Total Assets66.8152.8206.9
Equity40.676.9110.9
Borrowings5.825.552.8
Other Liabilities20.347.343.2

Assets grew from ₹152.8 Cr to ₹206.9 Cr—a ₹54.1 Cr jump. The increase was funded partly by retained profits (equity grew ₹34 Cr) and partly by debt (borrowings jumped ₹27.3 Cr).

The company holds ₹0.84 Cr in cash and equivalents and ₹0.21 Cr in bank deposits short-term—liquid reserves of ₹1.05 Cr. Against ₹52.8 Cr in total borrowings, net debt stands at ₹51.75 Cr.

Trade receivables of ₹135.2 Cr against annual revenue of ₹197.4 Cr suggests the company is extending 250 days of credit to customers (trade receivables turnover ratio sits at ~1.5x). Inventory of ₹31.6 Cr represents ~60 days of cost of goods sold. Together, working capital tied up is substantial—₹166.8 Cr of current assets against ₹58.3 Cr of current liabilities, leaving net working capital of ₹108.5 Cr.

Three bullet takes:

  • The balance sheet is doing a handstand: liabilities grew faster than the cash to cover them. Borrowing-to-assets ratio climbed from 17% to 26%.
  • Trade receivables are a monster. At 250 days, the company is financing half the year’s revenue upfront. This is typical in farm sales (harvest cycles, seasonal cash flow), but it’s capital-hungry.
  • The company has no financial cushion. Cash of ₹1 Cr against debt of ₹53 Cr and capex of ₹55 Cr means every rupee of operating cash flow matters.

One wisdom line: a balance sheet that grows faster than profits is a credit card masquerading as a business.


8. Cash Flow: Sab Number Game Hai

YearOperating CFInvesting CFFinancing CF
FY24-13.7-6.220.4
FY25-22.4-11.333.4
FY26-11.4-11.222.9

Operating cash flow (OCF) turned negative in FY24 (₹-13.7 Cr), worsened in FY25 (₹-22.4 Cr), and improved slightly in FY26 (₹-11.4 Cr). The pattern is clear: net profit is positive, but the company is converting less and less of it into cash.

The culprit: trade receivables. Between FY25 and FY26, receivables grew by ₹27.3 Cr—a cash outflow disguised as a sale. Inventories grew by ₹14.1 Cr. Together, working capital consumed ₹41.4 Cr of cash, more than the ₹35.2 Cr profit earned.

Investing cash flow was negative in all three years (capex was the main drag). FY26’s capex was ₹54.9 Cr—more than profit.

Financing cash flow was positive because the company borrowed. Borrowings increased by ₹27.3 Cr in FY26. The company is funding growth via debt, not cash generation.

Wisdom: a company that cannot convert profit into cash is not scaling—it’s mortgaging the future.


9. Ratios: Sexy or Stressy?

RatioValue
ROE36.9%
ROCE37.9%
Net Debt / Equity0.47x
Interest Coverage16.4x
Current Ratio2.97x

ROE of 36.9% is the stand-out figure—the equity is earning high returns on the capital employed. ROCE of 37.9% suggests operating assets are productive. Both figures are well above the cost of capital and the peer set.

Net debt of ₹51.75 Cr against equity of ₹110.9 Cr gives a ratio of 0.47x—modest leverage by industrial standards. Interest coverage (EBIT to interest expense) sits at 16.4x. With ₹51.9 Cr in EBITDA and ₹3.12 Cr in interest costs, debt service is not strained.

Current ratio of 2.97x shows current assets can cover short-term liabilities 3x over. On the face, liquidity is comfortable. But this masks the receivables jam: most of those current assets are uncollected invoices and stale inventory, not cash.

Return on assets (ROA) was 19.6%, calculated as net profit (₹35.2 Cr) divided by average total assets (₹179.85 Cr). The company is generating almost 20 paise of profit per rupee of assets employed—solid.

But the gap is stark: high profitability + high leverage + negative free cash flow = a business running on fumes and hope.


10. P&L Breakdown: Show Me the Money

YearRevenueEBITDAPAT
FY2450.35.55.4
FY25130.335.223.9
FY26197.451.935.2

Revenue grew 160% from FY24 to FY26. EBITDA grew 845%. Profit after tax grew 552%. Profit growth is outpacing revenue growth—operating leverage is alive.

EBITDA margins expanded from 11% in FY24 to 26.5% in FY26. The company’s core operations are improving: either pricing is rising, or cost control is sharp, or (most likely) both. Tax as a % of profit before tax was 26% in FY26—consistent with India’s corporate tax rate.

The three-year arc tells a business hitting stride operationally but struggling with cash conversion. The profit is real. The cash isn’t following.


11. Peer Comparison

CompanyRevenue (₹ Cr)PAT (₹ Cr)P/EROCE
Supreme Industries3,52843448.620.7%
Astral2,08921375.019.9%
Garware-Wall Rope59710843.018.0%
Time Technoplast1,67713418.816.7%
R M Drip19735.223.437.9%

R M Drip is the smallest company by revenue—1/18th of Supreme Industries, 1/12th of Astral. But its ROCE is the highest in the peer set.

At 23.4x P/E, the company trades below Supreme (48.6x) and Astral (75x), but above Time Technoplast (18.8x). The multiple is justified by superior returns, but only if those returns persist. For a company burning cash, that’s an assumption.


12. Miscellaneous: Shareholding & Promoters

Holder%
Promoters21.1%
FIIs3.85%
DIIs0.10%
Public75.0%

Promoter holding has eroded sharply. As of June 2025, promoters held 21.06%. A year earlier (June 2024), they held 13.86%. Over the prior three years, the holding fell from 33.79% (April 2023) to 21.06% (June 2025).

The main promoter is Nivrutti Pandurang Kedar, who held 18.03% as of June 2025. The bonus issue in April 2026 would have diluted this further.

Short bio: Kedar has 35+ years in agriculture and irrigation business. He was the original founder. His son, Atharva Nivrutti Kedar, is the Managing Director (appointed January 2026, replacing Nivrutti). Atharva is B.Tech in Civil Engineering and was managing the real estate side before taking over operations.

Roast: when the founder’s son steps in as MD and dad steps back, it’s either a succession play or a sign that the founder found the cash burn frustrating. The timing—just as debt jumped—suggests the latter.

FII holding has crept up to 3.85% (India Emerging Giants Fund owns most of this). DII holding is negligible at 0.10%. The public holds 75%, which means 44,653 shareholders own the float as of March 2026—a wide, shallow retail base.


13. Corporate Governance: Angels or Devils?

The statutory auditors are Bilimoria Mehta & Co. (FRN 101490W). They issued an unmodified audit opinion—no red flags on the audited financials.

The internal auditor is M/s SHARPS & CO., reappointed in May 2026. No major audit adjustments are flagged in the notes.

In April 2026, the SEBI conducted a search at the promoter directors’ premises on April 22–23, 2026. The company reported no material impact and stated the search was routine. This is standard procedure for trading investigations; no details have emerged.

In January 2026, Independent Director Kavita Ashish Pandare resigned citing personal reasons. She was replaced with an external independent director in the subsequent postal ballot (April 2026).

Credit rating: Brickwork Ratings withdrew its ratings in April 2026 after the company stopped cooperating with the rating agency. The prior rating was BWR B- (long-term, bank loans). Withdrawal is a compliance step when the issuer doesn’t provide financials. It’s not a downgrade, but the signal is: the company is a lender-focused story now, not institutional-debt-focused.

Related party transactions: minor. The company has loan transactions with subsidiaries (Tuljai Agro Chemicals, Brahmanand Pipes) but these are consolidation adjustments. No egregious RPT from the promoter to the company at inflated prices.

Dividend policy: 3% dividend for FY26, paid out in FY27 (₹0.75 Cr). The payout ratio is 2% of PAT. This is conservative and signals the company is reinvesting profits into capex and working capital, not returning capital to shareholders.

Pledges: zero pledges on promoter shareholding as of March 2026. The promoter is not mortgaging his stake, which is a small relief given the debt climb.


14. Industry Roast & Macro Context

Micro irrigation in India is penetrated at ~10–15% of irrigated farmland. The market is ₹786 Cr (2026E) and expected to reach ₹1.3 Bn+ by 2031 (~11% CAGR). Irrigation automation is smaller but faster-growing: ₹252 Cr in 2024, projected to hit ₹899 Cr by 2030 (~24% CAGR).

The sector has structural tailwinds. Water scarcity across India’s agricultural heartland (Maharashtra, MP, Karnataka, UP) is acute. Groundwater depletion is pushing farmers toward efficiency. Government subsidies (PMKSY, Pradhan Mantri Krishi Sinchayee Yojana) pay 45–55% of farmer capex, reducing the out-of-pocket barrier.

But the sector is also brutally competitive. It’s low-tech, low-capex to enter. Margins compress on commodity items (PVC pipes, standard drippers) and get sticky only on high-value items (automation software, turnkey design services). R M Drip’s push into smart irrigation and Godrej partnerships is a smart defensive move—harder for competitors to replicate.

Pricing wars are latent. Larger players like Supreme Industries have diversified into irrigation but keep margins tight to maintain volume. Margins for R M Drip (26.5% operating margin) are well above the peer set because the company has cornered the dealer network in specific geographies (West + Central 52%, South 38%, North 10%) and built brand equity among farmers in those regions.

Distribution is the real moat here. Building 1,000 dealers in 18 months is not easy. Each dealer has competing suppliers, farmer relationships, and margin expectations. RM Drip’s edge is that it offers a full system (design, installation, credit through dealers) rather than just a product. But as competitors replicate this, prices will erode.


15. EduInvesting Verdict

Strengths:

  • Revenue growing 51% YoY with EBITDA margin expanding to 26.5%.
  • ROCE (37.9%) and ROE (36.9%) well above peer set and cost of capital.
  • Dealer network scaled 3x in 18 months; geographic footprint expanding.
  • Addressable market (micro irrigation + automation) has 10+ year runway at high growth rates.
  • New IoT automation platform entering 5% of revenue by FY27, with 30%+ growth expected.

Weaknesses:

  • Operating cash flow negative for three consecutive years; FY26 OCF was ₹-11.4 Cr.
  • Trade receivables at 250 days; working capital growing faster than profit.
  • Capex aggressive (₹54.9 Cr in FY26); free cash flow was ₹-66.3 Cr.
  • Debt jumped 2x in one year; net debt / equity at 0.47x but rising.
  • Promoter ownership dropped from 33.79% to 21.06% in three years; new MD (son) just took over.

Opportunities:

  • Automation platform entry (IoT / smart irrigation) into a ₹899 Cr market growing at 24% CAGR.
  • Partnership with Godrej Agrovet unlocks 25 new distribution points and cross-selling.
  • Subsidiary Brahmanand Pipes acquisition adds 12,000 MT capacity by Q2 FY27; backward integration should improve margins on high-volume pipes.
  • Government backing (PMKSY, Telangana Oil Palm Mission) ensures sustained subsidy support for micro irrigation adoption.

Threats:

  • Cash burn unsustainable if revenue growth slows. At current trajectory, the company will need to raise capital (equity or debt) within 12–18 months.
  • Receivables management is a weak point. If dealers delay payments or demand higher discounts, OCF could deteriorate further.
  • Larger industrial-products players (Supreme, Astral) have scale and capital to enter micro irrigation aggressively and undercut on price.
  • Credit rating withdrawal signals lender confidence has eroded. Future borrowing will be expensive.
  • Bonus dilution (5:7 ratio) and potential future capital raises will compress EPS mechanically.

Closing Observation:

The company is a portrait of growth-at-any-cost: exploding revenues, expanding margins, soaring returns on equity, and cash that is nowhere to be seen. The expansion into smart automation and the Godrej partnership are genuine strategic moves—not financial engineering. But the core tension remains unsolved: a balance sheet that requires ₹130+ Cr of debt and capex each year to sustain 50% revenue growth, while operating cash flow runs negative.

This is a business built for a bull market, where capital is cheap and growth investors reward expansion. It works until sentiment flips and creditors ask for cash. The company has a 12–18 month runway before that trade-off becomes acute. What happens then depends on whether the Brahmanand facility actually delivers the margin uplift management is banking on, and whether the smart irrigation platform can move from “expected 5% of revenue” to “generating cash.”

Until then, this is a spectator’s company—thrilling to watch, risky to own.

Leave a Reply
