1. At a Glance
The industrial packaging sector is often dismissed as a “proxy play,” yet Pyramid Technoplast is currently demanding a second look as its aggressive expansion strategy hits the P&L. For the quarter ended March 31, 2026, the company reported a Net Profit of ₹10 crore, representing a massive 51.6% jump YoY. This isn’t just a paper gain; it is the result of a massive capacity ramp-up that saw total sales volumes surge 20% for the full year.
The company is gaining significant investor attention because it is successfully pivoting toward high-value segments. Its Intermediate Bulk Containers (IBC)—the 1,000-liter giants of the packaging world—saw volume growth of 31% YoY. While the top line is expanding, the internal mechanics are shifting toward a “utilization and leverage” phase. Management has officially declared the end of its heavy capex cycle, signaling a shift from building factories to milking them for cash.
However, it is not all smooth sailing. The balance sheet has bloated significantly. Total Liabilities have jumped to ₹527 crore, nearly doubling from two years ago. The debt-to-equity ratio, while manageable, is creeping up as the company fuels its ambitious solar and recycling projects. Investors are now watching to see if the promised ₹15 crore annual power savings from their new 15.25 MW solar initiative actually materializes in the coming quarters or if it remains trapped in “testing and ramp-up” delays.
2. Introduction
Pyramid Technoplast is an industrial packaging powerhouse that has spent the last 26 years mastering the art of polymer-based molded products. Operating out of 9 manufacturing units across Gujarat and Maharashtra, the company has transformed itself from a local drum maker into a Pan-India player with a production capacity of 76,931 MTPA.
The beauty of this business lies in its “sticky” nature. You don’t just sell a drum; you sell a critical logistical component to giants in the chemical, agrochemical, and pharmaceutical sectors. When companies like Adani Wilmar, JSW, or United Phosphorus Limited move their hazardous chemicals or raw materials, they rely on Pyramid’s UN-certified containers to ensure nothing leaks.
In the world of finance, we often say that “volume is vanity, but profit is sanity.” Pyramid is currently chasing both. The recent commissioning of the Wada plant in Maharashtra has added significant muscle to their operations, allowing them to service the high-demand Western corridor more efficiently.
This article explores whether the company’s massive bet on backward integration—specifically in recycling and captive power—is the masterstroke it appears to be, or if the rising interest burden will stifle the very growth it seeks to fuel.
3. Business Model – WTF Do They Even Do?
At its core, Pyramid Technoplast makes high-tech “boxes” and “bottles” for grown-ups—specifically, the kind that hold industrial chemicals. They don’t just blow air into plastic; they manufacture high-density polyethylene (HDPE) containers and mild steel (MS) drums designed to survive the brutal conditions of global shipping.
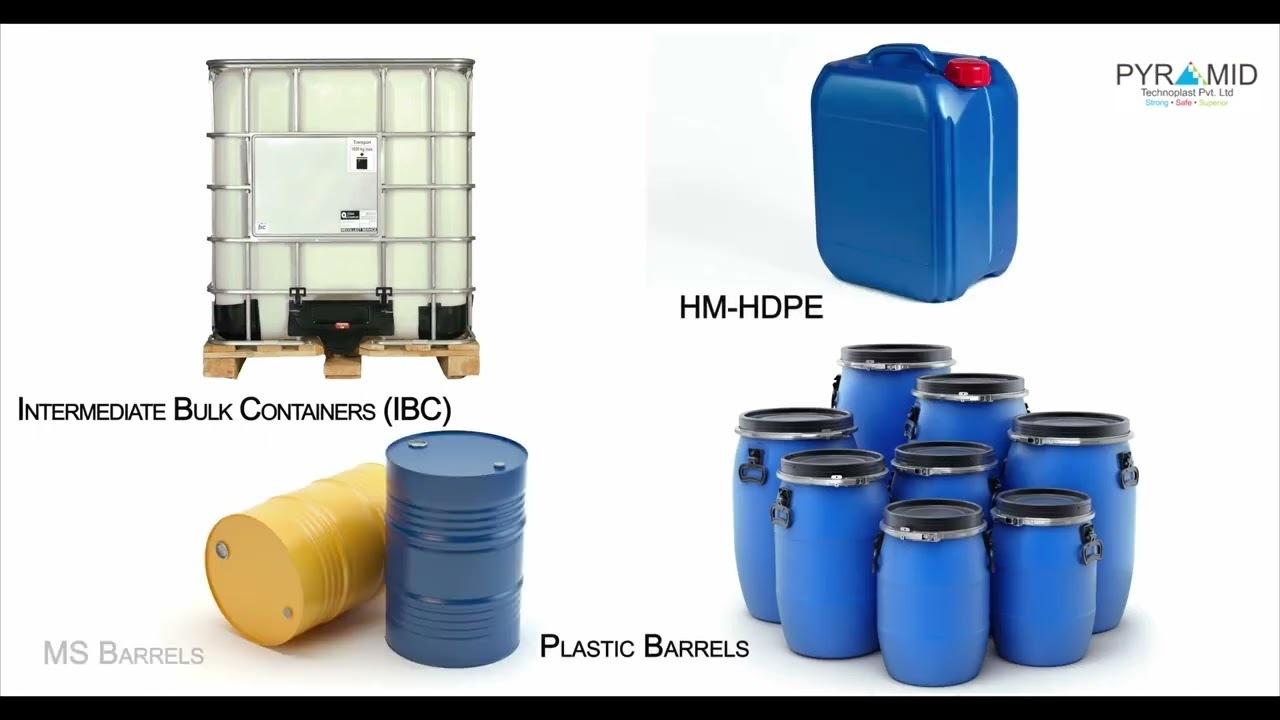
Their product portfolio is split into four distinct buckets:
- Polymer Drums: The bread and butter. Ranging from 20 to 250 liters, these are the narrow-mouth and open-top drums you see stacked in chemical warehouses.
- Intermediate Bulk Containers (IBC): The high-margin “Superstars.” These are 1,000-liter tanks encased in a steel cage. They are the gold standard for bulk liquid transport.
- MS Drums: For the heavy-duty stuff that plastic can’t handle.
- Ancillary Operations: They even make their own caps, lids, and handles. It’s like a bakery that grows its own wheat.
The business model is built on backward integration. By recycling their own polymer and generating their own solar power, they are trying to insulate themselves from the wild swings of raw material prices (Polymer and Steel). It’s a smart move in an industry where margins are usually thinner than a plastic bag.
4. Financials Overview
Management seems to have walked the talk regarding volume growth, but the “operational leverage” is still a work in progress. While revenues grew 14% this quarter, expenses rose by 18%, largely due to the commissioning of new plants.
Quarterly Performance Comparison (Figures in ₹ Crores)
| Metric | Latest Quarter (Mar ’26) | Same Qtr Last Year (YoY) | Previous Qtr (QoQ) |
| Revenue | 195 | 171 | 161 |
| EBITDA | 20 | 12 | 11 |
| Net Profit (PAT) | 10 | 7 | 5 |
| EPS (Annualised) | 10.88* | 7.92 | 5.16 |
Financial Wisdom: When a company finishes a major capex cycle, the “Depreciation” and “Interest” ghosts usually haunt the P&L before the “Revenue” angel arrives. Pyramid’s depreciation jumped 70% YoY—a clear sign of new assets hitting the books.
*Annualised EPS calculated as $Q4\ EPS$ (which is full-year actual representation for March).
5. Valuation Discussion – Fair Value Range
To understand if the market is being fair to Pyramid, we look at three distinct lenses.
Method 1: P/E Approach
The current P/E stands at 20.9x. Given the industry median of ~19.8x and the company’s projected 15% revenue growth for FY27, a justified P/E range is 18x to 22x.
- Calculation: $Annualised\ EPS\ (₹7.83) \times P/E\ (18\ to\ 22) = ₹141\ to\ ₹172$.
Method 2: EV/EBITDA
With an Enterprise Value (EV) of ₹780 Cr and TTM EBITDA of ~₹59 Cr, the EV/EBITDA is 13.2x. For a growing industrial packaging firm, a fair multiple is 12x to 14x.
- Calculation: $(EBITDA\ ₹59\ Cr \times 12\ to\ 14) – Net\ Debt = ₹135\ to\ ₹165\ per\ share$.
Method 3: DCF (Simplified)
Assuming a conservative 12% FCF growth for 5 years and a 10% discount rate, the intrinsic value leans toward the higher end of the current market price, supported by the expected ₹15 Cr annual savings from solar.
Fair Value Range: ₹145 – ₹175
This fair value range is for educational purposes only and is not investment advice.
6. What’s Cooking – News, Triggers, Drama
There is plenty of “masala” in the recent filings. First, the Company Secretary musical chairs: Pyramid has seen two resignations in the compliance department within five months. While maybe just a coincidence, auditors and “detective” investors usually keep a close eye on frequent exits in the secretarial office.
Then there is the EGM on May 23, 2026. The company is seeking approval to hike its borrowing and asset disposal limits to ₹500 crore. They are essentially asking for a bigger credit card. Management says this is for flexibility, but it’s a bold move for a company with a ₹600 Cr market cap.
On the spicy side, the Wada plant is now “in full swing,” and management is bragging about it becoming profitable within six months. They are also waiting for a “pollution control board” license to handle unwashed containers at their recycling plant. If that license comes through by July ’26, the recycling margins could get a serious boost.
7. Balance Sheet
The balance sheet is where the heavy lifting is visible. The company has moved from being a lean operation to a capital-intensive beast.
| Particulars | Mar 2024 | Mar 2025 | Mar 2026 (Latest) |
| Total Assets | 303 | 369 | 527 |
| Net Worth | 222 | 249 | 277 |
| Borrowings | 20 | 55 | 184 |
| Other Liabilities | 61 | 64 | 67 |
| Total Liabilities | 303 | 369 | 527 |
- Borrowings have tripled in one year—apparently, solar panels and recycling machines don’t grow on trees.
- Inventory has ballooned to ₹107 Cr, up from ₹61 Cr. That’s a lot of plastic sitting in the warehouse.
- Fixed Assets have crossed ₹237 Cr, proving that management is serious about being a “Pan-India” player, even if the bank account feels the heat.
8. Cash Flow – Sab Number Game Hai
The cash flow statement tells a story of a company that is eating its own cash to grow.
| (Figures in ₹ Cr) | Mar 2024 | Mar 2025 | Mar 2026 |
| Operating Cash Flow (CFO) | -39 | -3 | -93 |
| Investing Cash Flow | -44 | -68 | -79 |
| Financing Cash Flow | 83 | 21 | 20 |
Where did the money go?
Essentially, Pyramid is in a “burn to build” phase. The negative CFO of ₹93 Cr in Mar ’26 is a massive red flag at first glance, primarily driven by a ₹46 Cr increase in inventory and a ₹28 Cr increase in receivables. They are selling more, but the cash is stuck in the working capital cycle. They are funding this gap by taking on more debt (Financing Cash Flow).
9. Ratios – Sexy or Stressy?
The ratios show a company undergoing a structural transition.
| Ratio | Mar 2024 | Mar 2025 | Mar 2026 |
| ROE (%) | 13% | 11% | 11% |
| ROCE (%) | 14% | 12% | 12% |
| P/E | – | 22.5 | 20.9 |
| PAT Margin (%) | 5.5% | 4.5% | 4.2% |
| Debt to Equity | 0.09 | 0.22 | 0.66 |
The Verdict: The Debt-to-Equity jump from 0.22 to 0.66 is “stressy.” However, if the solar and recycling plants deliver the promised ₹17-18 Cr in annual savings/EBITDA, these ratios should start looking “sexy” again by FY27.
10. P&L Breakdown – Show Me the Money
A three-year look at the income statement shows a steady upward climb in revenue, but a struggle to maintain margins.
| (Figures in ₹ Cr) | Mar 2024 | Mar 2025 | Mar 2026 |
| Revenue | 532 | 591 | 681 |
| EBITDA | 49 | 47 | 59 |
| PAT | 29 | 27 | 29 |
Commentary:
Revenue is up, but PAT is basically flat compared to two years ago. It’s like running a marathon and realizing you’re in the same place because the treadmill is moving backward. The culprit? Interest costs soared from ₹2.7 Cr to ₹7.5 Cr and Depreciation rose from ₹8 Cr to ₹12 Cr. The new plants are producing drums, but they are also producing a lot of “non-cash” and “interest” expenses.
11. Peer Comparison
How does our plastic drum king stack up against the big boys?
| Company | Revenue (Cr) | PAT (Cr) | P/E Ratio |
| EPL Ltd | 1300 | 103 | 16.9 |
| TCPL Packaging | 452 | 25 | 19.8 |
| Pyramid Technoplast | 195 | 10 | 20.9 |
| Polyplex Corp | 1682 | 30 | 91.8 |
Notes: Pyramid is currently trading at a slight premium to EPL and TCPL in terms of P/E. It’s the “new kid on the block” trying to prove it can play in the big leagues. Polyplex is in a different orbit of misery/valuation right now, making Pyramid look like a stable alternative.
12. Miscellaneous – Shareholding and Promoters
The promoters are holding onto their shares like a child with a favorite toy.
| Category | Sep 2023 | Mar 2026 |
| Promoters | 74.94% | 74.94% |
| FIIs | 2.44% | 0.97% |
| DIIs | 3.58% | 3.26% |
| Public | 19.05% | 20.83% |
Promoter Roast: The Agarwal family (Bijaykumar, Jaiprakash, and Madhu) controls nearly 75% of the company. While high skin in the game is good, the FIIs seem to be quietly exiting the room, dropping from 2.44% to under 1%. Maybe the “FIIs” don’t like the smell of burning plastic or rising debt?
13. Corporate Governance – Angels or Devils?
On paper, everything looks clean. No pledges, UN-certified products, and a board that meets regularly. However, a “detective” would note the resignation of the Company Secretary twice in a year. While the company claims “personal reasons,” frequent changes in the person responsible for signing off on legalities can sometimes signal internal friction.
The auditors haven’t raised any major red flags, but the capitalization of interest cost is something to watch. When companies capitalize interest, they move an expense from the P&L to the Balance Sheet, making current profits look better than they are. With ₹184 Cr in debt, the way they account for interest is crucial.
14. Industry Roast and Macro Context
The industrial packaging industry is essentially a “fancy trash” business. You build a expensive machine to make a container that someone else will use to ship chemicals, and then likely discard or recycle. It is a low-margin, high-volume game where the only way to win is to be the lowest-cost producer.
The sector is currently facing a double-whammy: Rising raw material costs (Steel and Polymer) and global supply chain disruptions. However, Pyramid is trying to “insulate” itself. By building solar plants and recycling units, they are basically telling the market, “We don’t care about the price of oil or coal.” It’s a bold strategy, but if the “circular economy” trend continues, Pyramid is well-positioned to be the greenest drum-maker in the shed.
15. EduInvesting Verdict
Pyramid Technoplast is at a classic “inflection point.” The infrastructure is ready, the Wada plant is humming, and the volume growth is undeniable (especially in IBC). Management has shifted from “Growth Mode” to “Execution Mode,” aiming for ₹800 crore revenue in FY27.
SWOT Analysis
- Strengths: Pan-India presence, 500+ diverse clients, 75% promoter holding.
- Weaknesses: Rising debt (₹184 Cr), negative operating cash flow, low dividend payout.
- Opportunities: ₹15 Cr annual savings from solar, 5,000 MT recycling capacity, growth in specialty chemicals.
- Threats: Raw material price volatility, high competition from unorganized players, interest rate hikes.
The next 12 months will determine if Pyramid can convert its massive asset base into actual cold, hard cash. If the EBITDA margins hit the promised 11-12% by June ’26, the company could be a powerhouse. If the debt continues to climb without a corresponding jump in CFO, it might just be another over-leveraged industrial story.
This fair value range and analysis are for educational purposes only and are not investment advice.