Tenneco Clean Air India FY26: Double-Digit Growth on Tighter Working Capital
General information and entertainment, not investment advice. The author is not a SEBI-registered adviser or research analyst. No recommendation, no promised returns. Markets carry risk including loss of capital. Figures may not be current. Consult a registered adviser before acting.
1 — At a Glance
The company recorded ₹5,404 Cr in consolidated revenue for FY26, against ₹4,890 Cr in FY25—an 11% climb. Profit before tax touched ₹816 Cr, net profit ₹604 Cr. Both divisions grew: Advanced Ride Technologies (the suspension juggernaut) pushed 20% ahead; Clean Air & Powertrain (exhaust, bearings, ignition) crawled at 5.5% on customer OEM mix shifts, not share loss. EBITDA crossed ₹925 Cr with margin at 17.1%. The tension: expansion is rapid, margins hold, but the multiple—37x earnings—sits well above the peer median of 27x. The balance sheet is fortress-like: net debt negative ₹0.4x equity. Cash conversion cycle continues at -30 days (working capital pulling money in). Capacity capex of ₹1,400 Cr over three years is already moving. The real question is whether the 50% market-share ambition on India’s darling tech (mechanical semi-active dampers) will re-rate the stock or just justify where it trades.
2 — Introduction
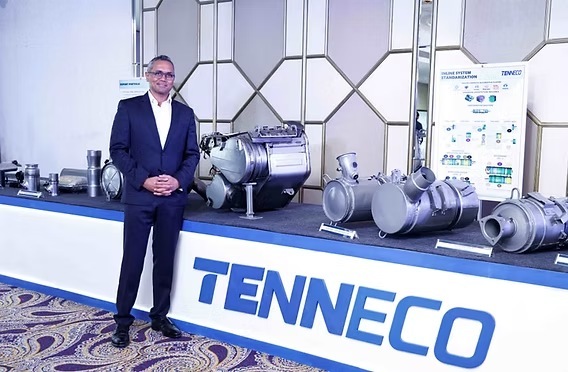
Tenneco Clean Air India was born in 2018 as a private subsidiary of Tennessee-based Tenneco Inc., a Tier-1 automotive parts supplier operating globally. The company went public on 19 November 2025 via a 61.8x oversubscribed IPO, raising ₹3,600 Cr via offer for sale; the stock has since moved from ₹397 (IPO price) to a reference of ₹515 (as of late May 2026).
The company lives at the intersection of two megatrends in Indian automotive. First: regulatory tightening. India is moving from BS VI toward BS VII emission standards by 2028, and the central government’s push to reduce CO₂ (CAFE) is forcing OEMs to electrify, hybrid-ise, downsize, and turbo—all of which demand more exhaust after-treatment and lighter suspensions. Second: localization. Major Japanese, Korean, and European OEMs are expanding India capacity as part of a China-plus-one strategy; this company supplies all top 7 PV OEMs and all top 5 CV OEMs, with 119 named customers in FY25, down from 277 in FY23 (the decline reflects consolidation around larger tier-1 relationships rather than customer loss).
The IPO validated scale: the offer was QIB 174.8x, retail demand matched. The board has since approved two greenfield plants—one in North India for Clean Air (and Japanese CV customers), one in West India for Advanced Ride Technologies—with capex rings around ₹1,400 Cr and commissioning expected between mid-2028 and 2029.
3 — Business Model: WTF Do They Even Do?
Tenneco India operates two divisions. Advanced Ride Technologies is the flashier: it makes shock absorbers and struts (passive and semi-active), using mechanical dampers that account for over 90% of passenger vehicle damping in India. The company’s marquee technology is DCx DaVinci, a mechanical first-derivative suspension system using shim stacks to selectively route hydraulic flow and deliver non-linear damping based on road input.
The pitch: traditional dampers use one tuning for all conditions (potholes, smooth highway, speed bumps). DaVinci delivers “85–90% of the way” toward electronic comfort with barely any cost delta and no wiring, ECU, or validation headache. The technical moat is narrow (shim stack tuning is well-understood), but the OEM adoption curve is steep: as of Q3 FY26, three to four major OEMs (Indian, Japanese, Korean, European) are sampling or awarded DaVinci for mid-to-premium SUVs; management’s ambition is 50% of the PV market within five to seven years.
Clean Air & Powertrain is the cash cow: catalytic converters (DOC, DPF, SCR systems), mufflers, exhaust pipes—the full clean-air stack for passenger vehicles, commercial trucks, and off-highway equipment. The company also makes engine bearings, sealing systems (gaskets, heat shields), and ignition products (spark plugs, coils) under the Champion brand, mostly through subsidiaries acquired as part of Tenneco’s historical roll-up of Federal-Mogul. Market share is commanding: 57% of commercial truck exhaust, 68% of off-highway, 52% of passenger vehicle shock absorbers.
Revenue mix for FY26: PV 63.5%, CV 21.5%, Industrial/Others 7%, Aftermarket 5.5%, Unclassified 2.5%. Clean Air & Powertrain accounts for 52.5% of value-added revenue; Advanced Ride for 47.5%. Geographic: domestic is 93% (and 6.5% exports to 18–22 countries across North America, Europe, APAC, Africa). Manufacturing footprint is 12 plants across 7 Indian states plus 1 union territory. Cold-end capacity utilization (mufflers/exhaust pipes) is 46%—a slack that invites capex. Hot-end (catalytic converters) runs 80%. Advanced Ride runs 86%.
The oldest business joke in Indian auto: “Everything is a commodity until regulation changes.” Here, regulation is changing twice: BS VII brings content tailwinds (more SCR, more GPF), and CAFE pushes cost-down and light-weighting. The company is positioned as a lever on both.
4 — Financials Overview
Figures are consolidated, in ₹ crore.
Metric
FY26
FY25
YoY Change
Revenue from Operations
5,403.98
4,890.43
+10.5%
EBITDA
924.98
815.39
+13.4%
PAT (Net Profit)
603.58
552.06
+9.3%
EPS (Reported)
14.95
13.68
+9.3%
Quarterly snapshot (Q4 FY26, ended 31 March 2026):
Metric
Q4 FY26
Q3 FY26
QoQ
Revenue
1,552.45
1,285.26
+20.8%
EBITDA
257.30
222.51
+15.6%
PAT
166.58
118.69
+40.4%
Operating Profit Margin
16.6%
17.3%
-70 bps
The headline: FY26 was a “best ever year” per management. Revenue growth of 10.5% masks two stories. Advanced Ride Technologies delivered VAR (value-added revenue) growth of 19.7%, outpacing the market. Clean Air & Powertrain grew at 5.5%, a deceleration vs. FY25. Management’s explanation: not share loss, but mix. Within OEMs, PV mix shifted toward budget-end SUVs (lower-margin product). Between OEMs, one European customer’s sales split to more EV, less ICE. The company explicitly stated it has not lost customer share; the narrative is customer-level product rebalancing.
EBITDA margin hit 17.1%, the highest on record. Management attributed this to P3 operating model execution (modular manufacturing, standardized “Lego brick” processes), improved absorption, and “timely commercial actions” (price resets). Quarterly margin in Q4 was 16.6%, down 70 bps from Q3 (17.3%), a signal that one-time benefits may not repeat.
PAT grew 9.3%, but net of a ₹272 Cr exceptional charge for new Labour Code compliance (one-time, expected to resolve once rules are finalized). Excluding that hit, profitability would have shown sharper growth.
5 — Market Expectations & Historical Multiples
This section describes how the market is currently pricing the company and how that compares with its own history and peer group. It is descriptive, not predictive.
Metric
Current
Peer Median
Historical Average (3Y)
P/E
37.2
27.4
~35
EV/EBITDA
23.0
~18
~24
ROE
44.4%
~20%
42%
ROCE
60.8%
~16%
57%
The market currently pays 37.2x earnings for Tenneco, versus a peer median of 27.4x—a