Patel Engineering Q4 FY26: Profit Jumps 118% but ₹2,681 Crore Contingent Liabilities and 86% Promoter Pledge Flash Red Signals
1. At a Glance
An engineering heritage spanning over seven decades can build impressive physical infrastructure, but it also carries heavy, structural balance sheet baggage. Patel Engineering Limited has captured public market attention by positioning itself directly at the center of the country’s mega-infrastructure rollout. The top-line numbers present a narrative of structural continuity, with full-year financial year 2026 revenue crossing the baseline threshold at ₹5,102.74 crore, representing a flat 0.2% growth compared to ₹5,093.40 crore in the prior fiscal period.
The quarter ended March 31, 2026, delivered a consolidated net profit attributable to owners of ₹71.50 crore, marking an apparent 118% surge relative to the ₹32.80 crore reported in the same quarter last year. This operational translation from stagnating revenues to highly volatile bottom lines is exactly why capital-intensive engineering stocks demand strict accounting inspection.
Beneath the headline earnings growth lie structural operating friction and significant balance sheet distress points that cannot be ignored. The operational performance shows immediate pressure at the gross execution layer. Operating EBITDA for the full year compressed by 6.7% to ₹684.00 crore, down from ₹733.20 crore in the prior fiscal period. This compression drug down full-year operating profit margins by 100 basis points, dropping from 14.40% to 13.40%. Management has pinned this margin erosion on project execution mix and mobilization schedules, but it reveals an underlying vulnerability to competitive bidding landscapes and sticky execution expenses.
The risk profile is heavily weighted by structural overhangs that directly threaten equity stability. First, the promoter group holds a low equity stake of 31.48%, and out of this thin exposure, an astronomical 86.60% of their total holding remains pledged to lenders. This creates an immediate margin-call risk if broader market volatility hits the stock price.
Second, the company is carrying an immense mountain of off-balance-sheet exposure, with contingent liabilities sitting at ₹2,681 crore. For a business with a total equity market capitalization of ₹2,605 crore, these unresolved legal and contract disputes represent an existential risk hiding in plain sight.
The cash conversion dynamics also demand structural skepticism. While working capital cycles are reported to have compressed to 81.8 days from historical averages, the core balance sheet reveals an inventory line items pileup sitting at ₹978.30 crore and Trade Receivables standing at ₹597.90 crore. A large portion of this capital remains stuck as unbilled revenues and claims stuck under slow arbitration channels.
Even with a capital infusion via a ₹398.97 crore rights issue executed in late 2025, the business remains dependent on aggressive asset monetization and regulatory write-backs to sustain nominal net cash flows. Can a business tied down by structural pledges, legal disputes, and shrinking execution margins safely pilot its massive ₹15,119 crore order pipeline without dropping the ball?
2. Introduction
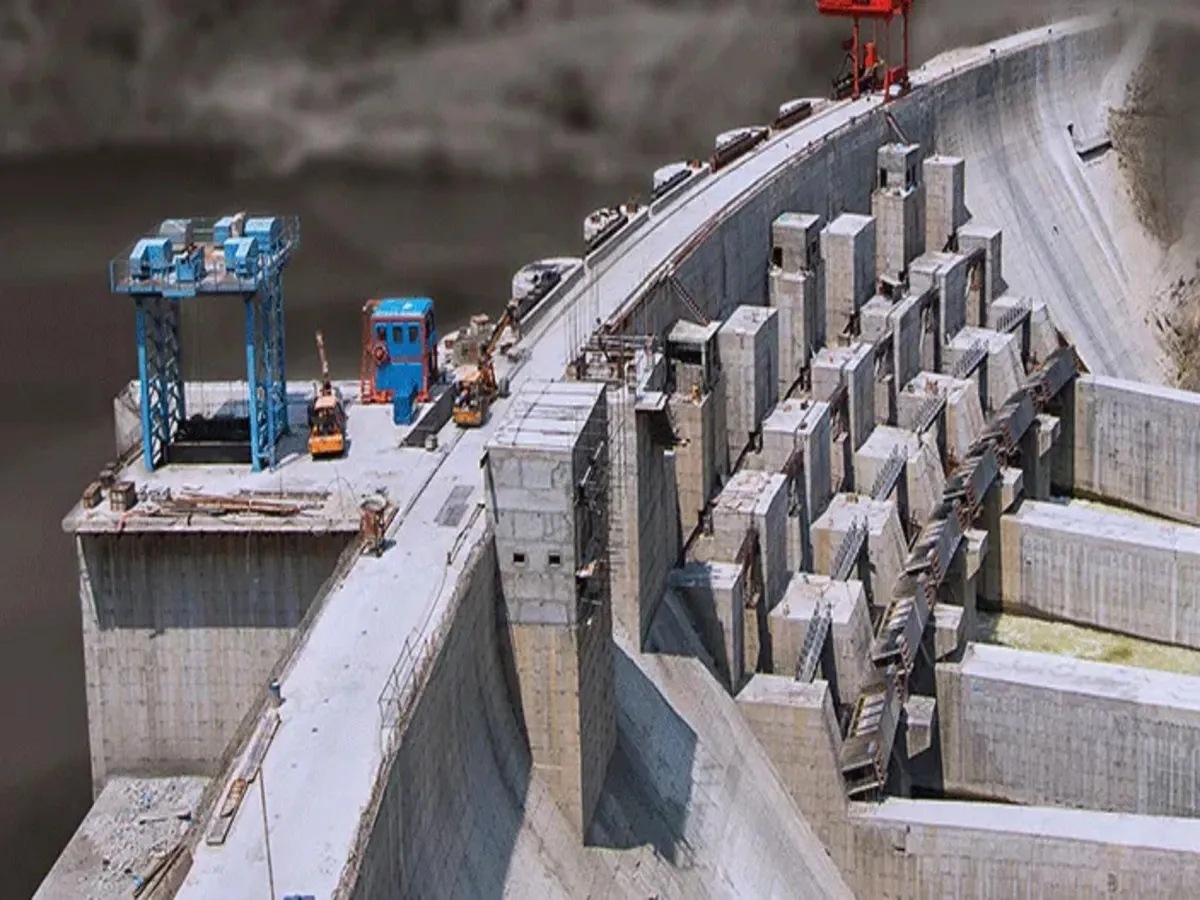
Patel Engineering Limited operates as a specialized heavy civil engineering infrastructure provider. The corporate structure focuses exclusively on asset classes characterized by complex geological risks, long gestation timelines, and high engineering entry barriers. The company’s engineering scope covers the execution of massive hydroelectric power stations, underground tunnel networks, large-scale irrigation distribution networks, dams, and basic urban transport infrastructure.
The corporate strategy has shifted away from multi-sector diversification, resulting in a heavy concentration in public sector hydro and tunneling projects. Out of the active project tracking portfolio, the corporate exposure to Hydroelectric and Dam infrastructure has increased to 63% of the outstanding order pipeline, leaving the entity structurally exposed to central and state public sector capital allocations.
The operational footprint spans 53 active domestic projects across 14 states, supplemented by long-duration cross-border public contracts within Nepal and Bhutan. The customer acquisition framework relies entirely on competitive competitive bidding with Central Government undertakings, state water resource departments, and public sector utility behemoths such as NHPC, NHAI, CIDCO, and Ircon International. This configuration effectively eliminates traditional counterparty default risks but introduces severe bureaucratic friction, protracted invoice verification delays, and rigid pricing mechanisms that offer no protection against localized raw material inflation.
The internal operational engine is heavily reliant on technological execution. The company deploys specialized infrastructure execution methodologies including the New Austrian Tunnelling Method (NATM), Earth Pressure Balancing Tunnel Boring Machine mechanics, Roller Compacted Concrete (RCC) dam formations, and double lake tapping systems. These technical competencies form the basis of management’s economic moat argument, allowing them to qualify for large-scale, technically complex public tenders.
However, long execution timelines mean that errors in early geological risk mapping or unhedged equipment charges can lock the company into low-margin or loss-making cash cycles for years.
The operational reality of the business is defined by the tension between high-profile execution benchmarks and sticky structural costs. In January 2026, the company claimed a national benchmark by drilling 812 meters of Tunnel Boring Machine (TBM) length in a single month at the CIDCO water tunnel site. Yet, despite hitting these specific field milestones, the institutional financial results remain constrained by slow cash generation, high interest costs, and legacy financing obligations.
3. Business Model – WTF Do They Even Do?
Patel Engineering is a high-stakes earth-mover that digs deep holes, diverts major rivers, and blasts massive underground caverns on the government’s dime. They are engineering heavyweights who operate in extreme terrains, managing massive structural risks where simple mistakes can derail an entire project’s profitability.
The operational model breaks down into four core engineering lines, each with its own cash and execution dynamics:
Hydropower & Dam Infrastructure
This is the core revenue driver, making up 63% of the company’s long-term backlog. The company builds massive water containment systems, high-altitude barrages, and underground machine halls. These are ultra-long-gestation infrastructure projects that require massive heavy equipment deployment. Revenue here is generated through progress-based billing milestones, meaning cash flow is highly dependent on state engineers signing off on completed work.
Tunnelling & Underground Engineering
A highly technical, high-barrier segment making up 5% of the backlogged order book but accounting for 16% of direct operational revenues. This involves deploying multi-million-dollar Tunnel Boring Machines and precision drill-and-blast methods. The technical requirements keep smaller competitors out, which helps protect operating margins. However, unexpected structural changes in the rock or machine breakdowns can quickly trap expensive working capital underground.
Irrigation & Water Supply
Accounting for 16% of the project backlog, this division focuses on building massive canal networks, lift irrigation stations, and cross-drainage water management layouts. These projects face constant real-world friction, including local land acquisition gridlocks, environmental clearance holdups, and seasonal weather stoppages.
Transportation & Urban Infrastructure
A residual segment that has been shrunk down to just 1.42% of the forward order book. This division handles basic road building, bridge construction, and suburban rail works. Management is intentionally stepping away from this space due to intense pricing competition and low margin profiles.
The underlying business model relies on maintaining a high order book-to-bill ratio, which currently sits at 2.96x based on their ₹15,119 crore backlog. But this backlog is entirely dominated by state and central government bodies, which make up 92% of the order book. This makes the company’s cash flow highly dependent on public sector payment timelines.
The company also faces structural drag from unbilled revenues and outstanding arbitration claims. While Patel Engineering builds out critical national infrastructure, it often has to fund complex field operations through working capital loans long before the state releases the corresponding milestone cash.
4. Financials Overview
A serious examination of Patel Engineering’s financials requires moving past headline numbers to look closely at the underlying margin changes and structural costs. The tables below show the consolidated performance across comparable quarterly and annual reporting windows.
The company’s top-line performance highlights an execution ceiling. Q4 FY26 revenues dropped 11.8% year-on-year to ₹1,421.50 crore, down from ₹1,611.90 crore in the prior year’s matching quarter. This drop shows that project progress across their 53 active sites is uneven. While management claims this variation is normal for multi-year infrastructure rollouts, it shows that revenues remain vulnerable to mobilization delays.
The profitability metrics reveal an interesting divergence. While the quarterly EBITDA margin improved to 15.14%, the full-year margin fell by 100 basis points to 13.40%. This confirms that the business is facing structurally higher core construction costs that are difficult to pass on quickly.
Full-Year Income Statement Compression (FY25 vs FY26):
Revenue: ₹5,093.40 cr ──► ₹5,102.74 cr (Flat at +0.2%)
EBITDA: ₹733.20 cr ──► ₹684.00 cr (Compressed by -6.7%)
PAT: ₹242.20 cr ──► ₹294.50 cr (Boosted by lower tax provisions)
The bottom-line improvements require careful analysis. The reported Q4 FY26 net profit increase to ₹71.50 crore was helped significantly by non-operating accounting adjustments, including other comprehensive income items and changes in tax provisions. Over the full year, the company’s profit before tax actually fell 11.7% to ₹287.60 crore, down from ₹325.70 crore in FY25.
The primary reason net profit rose to ₹294.50 crore was an 80.2% reduction in reported tax expenses, which dropped from ₹89.50 crore down to just ₹17.70 crore due to legacy assessment write-backs. Relying on tax adjustments rather than core operational growth to drive net profits shows why these earnings need to be viewed with caution.
How sustainable can a bottom-line turnaround be when it is driven by shifting tax write-backs rather than core operational growth?
5. Valuation Discussion
To understand where Patel Engineering sits on the valuation spectrum, we need to analyze its trailing metrics alongside standard financial models. The stock currently trades at a market capitalization of ₹2,605.36 crore against an ongoing market price of ₹26.26.
Valuation Disconnect Summary:
Market Price: ₹26.26
Stock P/E: 6.54x
Industry Average P/E: 18.00x
Book Value per Share: ₹44.80
Price-to-Book Value: 0.59x
The stock’s trailing Price-to-Earnings (P/E) multiple sits at 6.54x, which looks cheap compared to the broader industrial peer average P/E of 18.0x. Similarly, the stock trades at a Price-to-Book (P/B) value of 0.59x against its reported book value of ₹44.80. While these low multiples might make the stock look undervalued at