1. At a Glance
A loss-making biologics CDMO trading at 283x earnings with a 740% revenue explosion. Backed by Strides Pharma. Promoters selling. FDA approvals incoming. Risky? Oh absolutely. Interesting? Very.
2. Introduction with Hook
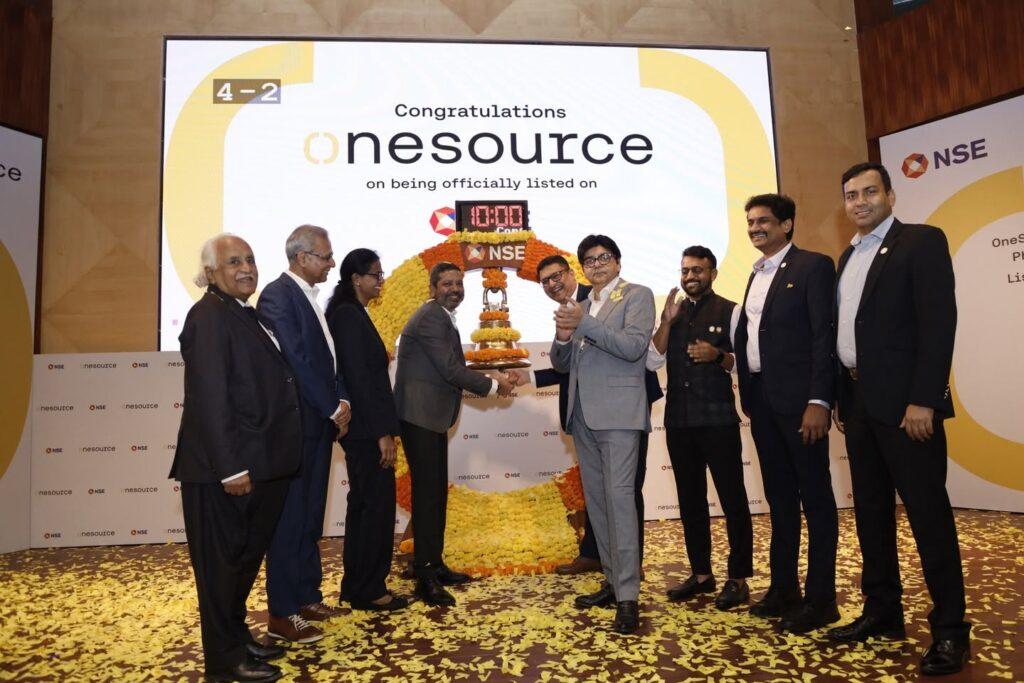
Imagine you’re in a biotech jungle. In one corner, big pharma is roaring. In another, a nimble gazelle named OneSource is sprinting—bruised, bleeding cash, but gaining speed.
- TTM Sales Growth: +740% (yes, you read that right)
- TTM Net Profit: -₹18 Cr, but last quarter? A surprise +₹98 Cr profit!
- Market Cap: ₹23,134 Cr with just ₹1,445 Cr in annual sales. Yikes?
So, are we looking at India’s version of Lonza or another bubble waiting to deflate?
3. Business Model (WTF Do They Even Do?)
OneSource is a CDMO—Contract Development and Manufacturing Organisation. Their job? Help big pharma and biotech firms make biologics and injectable drugs.
Revenue Engines:
- R&D services
- Clinical development
- Technology transfer
- Regulatory support
- Commercial-scale biologics manufacturing
Key USP?
They ride the biologics wave, targeting the €23 billion biosimilar market globally. Also, they’re GMP-certified by Brazil (ANVISA), with USFDA inspections cleared (with VAI classification).
In short:
OneSource = Labcoat + Scalability + Compliance + Global ambition.
4. Financials Overview
Let’s be real. They’re just exiting their burn phase.
| Metric | FY21 | FY22 | FY23 | FY24 | FY25 |
|---|---|---|---|---|---|
| Sales (₹ Cr) | 21 | 128 | 39 | 172 | 1,445 |
| Net Profit (₹ Cr) | -121 | -231 | -800 | -391 | -18 |
| OPM (%) | -334% | -3% | -415% | -48% | 32% |
| ROCE (%) | — | -3% | -12% | -12% | 5% |
| Debt (₹ Cr) | 386 | 1,182 | 864 | 571 | 942 |
From -₹800 Cr loss in FY23 to breakeven in FY25. OPM has turned positive—finally.
5. Valuation
OneSource is trading at 283x earnings—the kind of number that makes even Tesla look humble. But should it?
Let’s attempt a sane DCF-ish ballpark:
- Assume FY26 sales of ₹2,000 Cr,
- OPM stabilizes at 30%,
- Net margins = 15%
- PAT ~ ₹300 Cr
- Assign P/E of 35 (industry avg for CDMO)
Fair Value = ₹10,500 Cr market cap → FV/share ~ ₹920
But current market cap = ₹23,134 Cr?
FV Range = ₹900–₹1,200, current = ₹2,021 = Very frothy.
6. What’s Cooking – News, Triggers, Drama
- Jun 2025: Partnership with Xbrane Biopharma, targeting a €23 billion biosimilars opportunity
- Apr 2025: Brazil ANVISA GMP certification for Unit-2
- Mar 2025: USFDA EIR received—good standing
- Feb 2025: Credit Rating upgraded, merger + equity infusion completed
- Promoter Stake Dropped by 3.5% in last quarter
- Strides Pharma is the puppet master
TL;DR – They’re suddenly everywhere. From Brazil to FDA, they’re now “compliant and competent.”
7. Balance Sheet
| Assets | FY25 (₹ Cr) |
|---|---|
| Fixed Assets | 6,276 |
| CWIP | 60 |
| Investments | 16 |
| Other Assets | 1,199 |
| Total Assets | 7,550 |
| Liabilities | |
|---|---|
| Equity + Reserves | 5,880 |
| Borrowings | 942 |
| Other Liabilities | 727 |
| Total Liabilities | 7,550 |
Key Observations:
- Reserves went from ₹392 Cr to ₹5,869 Cr. Likely due to merger infusion.
- Debt is stable at sub-₹1,000 Cr.
- Fixed asset heavy = future operating leverage.
8. Cash Flow – Sab Number Game Hai
| Cash Flow | FY25 (₹ Cr) |
|---|---|
| Operating Activity | -68 |
| Investing Activity | -201 |
| Financing Activity | +412 |
| Net Cash Flow | +143 |
Highlights:
- Still not cash positive from ops
- Relying on financing activities to survive
- Capex-intensive build-out still underway
9. Ratios – Sexy or Stressy?
| Ratio | FY25 |
|---|---|
| ROCE | 5% |
| ROE | 2.6% |
| Debtor Days | 105 |
| Inventory Days | 133 |
| Payable Days | 147 |
| CCC | 91 |
| Debt/Equity | ~0.16 |
Not too hot, not too cold—classic Goldilocks startup story. But don’t be fooled—working capital is still tight.
10. P&L Breakdown – Show Me the Money
| Quarter | Sales (₹ Cr) | Net Profit (₹ Cr) | OPM % |
|---|---|---|---|
| Jun 2024 | 78 | -33 | 7% |
| Sep 2024 | 334 | -42 | 23% |
| Dec 2024 | 393 | -69 | 36% |
| Mar 2025 | 426 | +98 | 43% |
Boom in margin. Q-o-Q story is +ve hockey stick. Let’s just hope it isn’t a boomerang.
11. Peer Comparison
| Company | Sales (₹ Cr) | PAT (₹ Cr) | ROCE (%) | P/E | M-Cap (₹ Cr) |
|---|---|---|---|---|---|
| Sun Pharma | 52,578 | 11,454 | 20.21 | 35.4 | 4,06,123 |
| Cipla | 27,547 | 5,142 | 22.72 | 23.2 | 1,19,183 |
| Dr Reddy’s | 32,643 | 5,549 | 22.7 | 19 | 1,05,115 |
| OneSource | 1,445 | -18 | 5.4 | 283 | 23,134 |
Verdict?
In terms of valuation vs fundamentals, OneSource is that kid in the playground wearing Louis Vuitton floaters while still learning how to walk.
12. Miscellaneous – Shareholding, Promoters
| Shareholder Group | Dec 2024 | Mar 2025 |
|---|---|---|
| Promoters | 37.76% | 34.25% |
| FIIs | 17.44% | 18.54% |
| DIIs | 12.56% | 18.03% |
| Public | 32.24% | 29.18% |
- Promoters trimmed stake in Q4. Hmm.
- FIIs and DIIs seem optimistic.
13. EduInvesting Verdict™
OneSource is a classic hockey-stick biotech growth story—full of hope, burning cash, and riding on regulatory wins. It’s clearly NOT priced on fundamentals today, but on dreams of tomorrow.
There are 2 outcomes here:
- They scale, execute, and grow into this valuation = Multibagger material
- They falter on execution or capital needs = Market will punish brutally
As always—CDMOs are capex-intensive and unforgiving. Execution is EVERYTHING.
Watchlist it like a hawk. Or wait for the market to stop pricing in utopia.
Metadata
– Written by EduInvesting Team | 21 July 2025
– Tags: Biotech, CDMO, FDA, OneSource Specialty, Pharma, Growth Stocks, Risky Bet


