General information and entertainment, not investment advice. The author is not a SEBI-registered adviser or research analyst. No recommendation, no promised returns. Markets carry risk including loss of capital. Figures may not be current. Consult a registered adviser before acting.
1. At a Glance
NIBE swung from ₹27 Cr net profit in FY25 to ₹5.63 Cr in FY26—a 79% collapse—while simultaneously bagging ₹293 Cr in fresh defence orders and raising ₹104 Cr in preferential funding.
The company’s OPM crashed from 12% to 9%, margins folded on Q4’s lumpy execution, and debtors exploded to 178 days. Yet the order book is now ₹77.72 Cr, demand signals flash green, and manufacturing capacity is expanding.
A company caught between cleanup and takeoff, where the numbers deteriorated hard last quarter but the forward engine room hums with momentum.
2. Introduction
NIBE manufactures precision-engineered defence components, small arms, avionics, and space systems. Incorporated 2005, listed on NSE. Headquarters: Pune.
FY26 was chaotic. Q4 (Jan–Mar 2026) brought a one-off tax hit (₹9.53 Cr tax on ₹37 Cr PBT—98% rate, a clear anomaly), lumpy execution that tanked profits, and workforce expansion that bloated costs.
But the company signed a ₹293 Cr contract with the Indian Army in January 2026, landed lifetime DPIIT licensing for firearms manufacturing via subsidiary NDAL, test-fired the Suryastra 300 km launcher system, and completed trials on the Vayu Astra loitering munition.
Promoter Ganesh Ramesh Nibe holds 48.6% (as of Mar 2026), down from 51% a year prior. FII participation now sits at 8.67%, having oscillated between 2% and 11% over recent quarters.
3. Business Model: WTF Do They Even Do?
Defence Platforms & Systems is the crown jewel—precision engineering for combat vehicles, missile systems, and structural assemblies using robotic welding, laser cutting, CNC/VMC machining. Partners include Larsen & Toubro, Bharat Forge, Adani.
Small Arms: High-precision rifles and ammunition, backed by SIG Sauer technology partnerships. Subsidiary NDAL just won lifetime MHA licensing.
Aeronautics & Avionics: Aviation solutions for defence and charter operators.
Electronics: Military-grade precision assemblies and defence R&D.
Space: Satellite and Earth observation systems.
Revenue mix FY25: Manufactured goods 69%, traded goods 5%, services 26%. Geography: entirely domestic (100% vs 94% in FY23; exports evaporated).
Three plants: Pune (2) handles heavy fab and small arms; Bangalore focuses on electronics.
4. Financials Overview
Figures are consolidated, in ₹ crore.
| Metric | FY25 | FY26 | YoY Change |
|---|---|---|---|
| Sales | 507 | 474 | -6.5% |
| EBITDA | 77 | 81 | +5% |
| PAT | 27 | 5.63 | -79% |
| EPS | ₹18.70 | ₹3.77 | -80% |
The top line shrank 6.5%. EBITDA edged up 5% (₹77 Cr → ₹81 Cr), cushioned by lower depreciation relative to growth in fixed assets. Net profit collapsed because of the tax anomaly and lumpy Q4 execution. The company reported ₹37 Cr PBT in Q4 but a 98% effective tax rate—₹9.53 Cr gone to tax—leaving ₹29.23 Cr net in the quarter. Over the full year, this became ₹5.63 Cr net after ₹39.6 Cr (FY25) swung to ₹3.93 Cr (FY26) at the PBT level.
Q4 saw ₹259 Cr revenue (up 130% YoY), a sharp Q3 → Q4 reversal from ₹73 Cr. Operating profit turned positive again (₹51 Cr vs negative ₹10 Cr in Q3), but the tax line is a forensic puzzle.
5. Market Expectations & Historical Multiples
This section describes how the market is currently pricing the company and how that compares with its own history and peer group. It is descriptive, not predictive.
| Metric | Current | 5-Yr Average | Peer Median |
|---|---|---|---|
| P/E | 391x | — | 60.8x |
| EV/EBITDA | 46.7x | — | 44.3x |
| P/B | 6.19x | — | 8.06x |
| ROE | 1.94% | 8.12% (3-yr) | 12.6% |
| ROCE | 4.79% | 16% (5-yr) | 15.45% |
The market pays 391x earnings here, against a peer median of 60.8x. This P/E is an artifact of depressed earnings (₹3.77 EPS)—a sinkhole year rather than a secular repricing. Normalise FY26 profits to, say, FY25 levels (₹18.70 EPS), and the multiple collapses to 77x, still above peers but in a different galaxy.
EV/EBITDA sits at 46.7x against a peer median of 44.3x—tightly grouped, suggesting the market values its EBITDA engine fairly.
ROE at 1.94% is comatose (peers: 12.6%). ROCE at 4.79% is fractional (peers: 15.45%). Both ratios are sabotaged by inflated assets (fixed assets jumped ₹65 Cr in 12 months) and anaemic profits.
The market appears to be pricing in: (a) a temporary profit trough, (b) order book conversion into margin recovery, (c) capacity utilisation lift from current low levels, and (d) leverage reduction via retained earnings.
6. What’s Cooking
₹293 Cr Indian Army Contract (Jan 2026): Rocket launcher equipment and ammunition. Delivery within 12 months. The company’s largest single order.
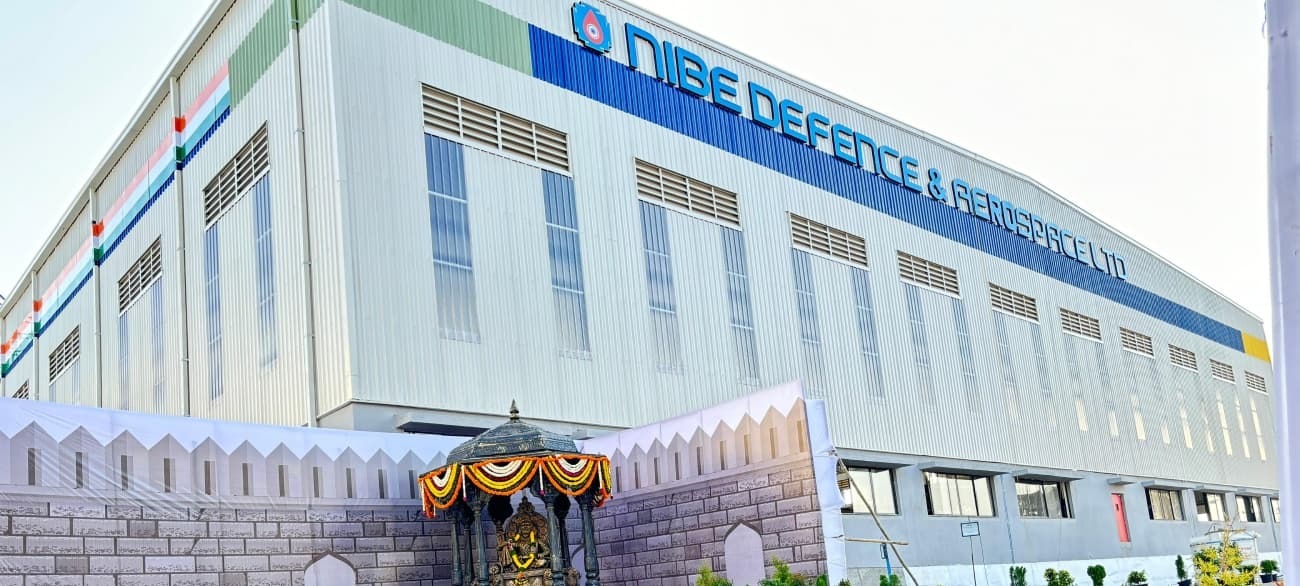
Shirdi Defence Complex Inauguration (May 2026): Flagged off the Suryastra 300 km system, announced 3,000 job hires.
Suryastra Launcher Trials (May 2026): 150 km and 300 km variants, both achieved sub-2.5m CEP (circular error probable). Production-ready.
Vayu Astra Loitering Munition Trials (May 2026): 100 km strike range, 90-minute endurance, night anti-armour capability. Completed.
NDAL Subsidiary Lifetime Licensing (June 2026): Subsidiary NDAL secured DPIIT license to manufacture and proof-test firearms and ammunition. Factory setup mandated within 7 years.
₹104.48 Cr Preferential Allotment (Mar 2026): 4.4 Lakh shares + 15.62 Lakh warrants at ₹1,258/₹1,248 per unit. Gross infusion: ₹251.85 Cr (upfront + exercise). Already deployed with no deviation reported (as of Mar 31, 2026).
CFO Resignation (Apr 2026): Jigar Shah resigned due to health issues. No replacement named yet.
FII Allotment (June 2026): Eminence Global Fund PCC allotted 3.2 Lakh shares at ₹1,258 (preferential).
7. Balance Sheet
| Item | FY24 | FY25 | FY26 |
|---|---|---|---|
| Total Assets | 316 | 442 | 653 |
| Net Worth | 161 | 232 | 348 |
| Borrowings | 73 | 77 | 120 |
| Other Liabilities | 82 | 133 | 185 |
| Assets = Liabilities | 316 ✓ | 442 ✓ | 653 ✓ |
Assets exploded ₹211 Cr in two years. Net worth rose ₹187 Cr, cushioned by retained earnings and the ₹104 Cr capital raise. Borrowings crept up ₹47 Cr to ₹120 Cr—manageable debt, not a load.
Three sharp observations:
The fixed asset base swelled ₹65 Cr in 12 months (from ₹138 Cr to ₹203 Cr) while sales contracted. Capacity built, utilisation not yet there. CWIP (capital work in progress) doubled to ₹62 Cr—the Shirdi plant is half-baked still.
Cash sits at ₹47 Cr, up from ₹9 Cr in FY25. Free cash flow, though, was ₹−120 Cr (capex ate everything). The company is burning cash while building.
Net cash position: ₹47 Cr cash minus ₹120 Cr borrowings = net debt of ₹73 Cr against ₹348 Cr equity. A leverage ratio of 0.34x D/E—low, loose, and sustainable.
8. Cash Flow: Sab Number Game Hai
| Year | Operating | Investing | Financing |
|---|---|---|---|
| FY24 | 18 | −124 | 111 |
| FY25 | 25 | −60 | 30 |
| FY26 | −35 | −77 | 127 |
Operating cash turned negative in FY26 (₹−35 Cr). Why? Debtors swelled to ₹231 Cr (178 days of sales outstanding—a red zone)—money tied up in receivables, not cash. Inventory is low (₹40 Cr, 43 days).
Investing remained a cash sink: ₹−77 Cr in capex and asset purchases. The Shirdi plant and capacity expansion are expensive.
Financing plugged the gap: ₹127 Cr inflow from the preferential allotment and warrant exercise drawdowns. Debt rose ₹47 Cr.
Free cash flow: Operating (₹−35 Cr) minus Investing (₹−77 Cr) = ₹−120 Cr. A company in heavy capex mode, not cash-generative.
9. Ratios: Sexy or Stressy?
| Ratio | FY26 |
|---|---|
| ROE | 1.94% |
| ROCE | 4.79% |
| P/E | 391x |
| PAT Margin | 1.19% |
| D/E | 0.34x |
ROE at 1.94%: equity is working part-time. The ₹348 Cr equity base, inflated by the ₹104 Cr capital raise and accumulated capex, earned only ₹5.63 Cr net. Return per rupee of shareholder capital: fractional.
ROCE at 4.79%: capital—both debt and equity—deployed into fixed assets and working capital is returning pennies on the rupee. Peers average 15.45%. A structural drag.
P/E at 391x: a statistical mirage. The denominator (EPS) is a trough. The numerator (price at ₹817.2 at year-end) is anchored on hope, not earnings.
PAT margin at 1.19%: for every ₹100 of sales, ₹1.19 reaches the bottom line. Pathetic. FY25 was 5.27%; FY24 was 6.6%. The trend is collapsing.
D/E at 0.34x: sensible, not stretched. The company can borrow more if it needs to.
10. P&L Breakdown: Show Me the Money
| Year | Revenue | EBITDA | PAT |
|---|---|---|---|
| FY24 | 282 | 42 | 19 |
| FY25 | 507 | 77 | 27 |
| FY26 | 474 | 81 | 5.63 |
FY25 was a growth spike: revenue surged 80%, EBITDA 83%. FY26 is a retreat: revenue down 6.5%, profits collapsed despite EBITDA holding steady. Why the divergence? Depreciation and interest bloated from ₹24 Cr (FY25) to ₹45 Cr (FY26)—the capex bill landed. Then tax atomised the profit.
EBITDA margin remains 17% (81 ÷ 474), consistent with FY25 (77 ÷ 507 = 15.2%). The operating business is intact. It’s the capital structure and the one-off tax that broke the PAT line.
11. Peer Comparison
| Company | Revenue (₹ Cr) | PAT (₹ Cr) | P/E | OPM |
|---|---|---|---|---|
| Bharat Electronics | 27,610 | 6,062 | 48.5x | 29% |
| HAL | 33,089 | 9,116 | 30.6x | 29.5% |
| Garden Reach Shipbuilders | 7,002 | 748 | 38.8x | 11.4% |
| NIBE | 474 | 5.63 | 391x | 9.4% |
| Peer Median | 480.9 | 53 | 60.8x | 21.3% |
NIBE is tiny—474 Cr revenue against a peer median of ₹481 Cr. It sits at the 25th percentile by scale. Its multiple is 6.4x the peer median. Its OPM is 44% of the peer median.
The gap isn’t a valuation inefficiency; it’s a reflection of scale and maturity. Bharat Electronics and HAL are consolidated, diversified, and printing 29% operating margins. NIBE is ramping, lumpy, and barely above 9%. The P/E premium is a rarity tax for a company the market believes will grow into its assets.
12. Miscellaneous: Shareholding & Promoters
| Holder | % |
|---|---|
| Promoters | 53.39% |
| FIIs | 8.67% |
| DIIs | 0.35% |
| Public | 37.59% |
Ganesh Ramesh Nibe, founder and MD, holds 48.6% (down from 51% a year prior). Wife Manjusha holds 4.51%. The family controls the company with 53%.
Promoter holding has declined 1.62% in 12 months (from 55% in Jun 2024). Likely: dilution from the ₹104 Cr preferential allotment, not selling. The family made room for fresh capital.
FII ownership is volatile: peaked at 11% in Dec 2023, crashed to 4.77% by Sep 2025, recovered to 8.67% by Mar 2026. International money playing momentum, not conviction.
DIIs: minuscule at 0.35%—domestic institutions have ignored this stock.
Ganesh is a hands-on founder with no scandals on record, no tax issues, no pledged shares. A clean slate in a sector where “clean” is noteworthy.
13. Corporate Governance: Angels or Devils?
Auditors: Deloitte Haskins & Sells (a Big Four shop, standard for listed defence companies).
Board: Mix of independent directors and promoter executives. No obvious red flags in recent filings.
Pledged shares: 0%. The promoter’s stake is unpledged—no margin calls, no forced selling signals.
Related-party transactions: Minimal. No sweetheart deals flagged in announcements.
Director changes: One non-executive director (Venkateswara Gowtama Mannava) resigned in Feb 2026. No scandal cited; often routine. CFO Jigar Shah resigned in April due to health—again, no governance bombshell.
Tax demands: None announced. No Aadhaar-style disputes with revenue authorities.
The company operates like a meritocratic engineering shop, not a shell. For a 20-year-old defence exporter, that’s a green light.
14. Industry Roast & Macro Context
The Indian defence manufacturing sector is a production mess dressed in a growth story.
Bharat Electronics and HAL hoard 80% of capacity and orders. Smaller players like NIBE are locked in a subsidy race—cheap deals, long payment cycles (178 debtor days here), and capex demands that would wreck a purely commercial P&L.
Pricing power: minimal. Competitors and the Army’s procurement teams keep margins thin. Margins in the 10–15% range are “good” here; 30% would trigger audit.
Regulation: Double-edged. GST, TDS, and compliance kill efficiency. But tariff walls and “Make in India” rules keep foreign competition out. NIBE’s small arms subsidiary (NDAL) just won lifetime licensing—a moat.
Macro tailwind: India’s defence budget is rising (₹71,000 Cr budgeted for FY27, up from ₹65,000 Cr), and geopolitical tension (Pakistan border, China sea-lanes) keeps demand hot. Orders are easy; conversions are not.
The sector rewards scale, capital, and patience. NIBE has capital now (₹104 Cr raised). Scale is coming (3,000 job hires announced). Patience is mandatory.
15. EduInvesting Verdict
| Factor | Strength / Weakness |
|---|---|
| Strengths | Order momentum (₹293 Cr Indian Army contract); capex foundation laid (Shirdi plant live); NDAL licensing (small arms entry); clean promoter (no pledges, no tax issues). |
| Weaknesses | Profitability collapsed FY26 (79% drop); ROE/ROCE abysmal (1.94% / 4.79%); debtors at 178 days (working capital stress); multiple at 391x (statistical distortion but a warning). |
| Opportunities | Suryastra & Vayu Astra production ramps (defence export adjacent); government procurement pipeline (3-4 year visibility on orders); capacity utilisation recovery (Shirdi plant at 30-40% utilisation now, upside to 70%+). |
| Threats | Lumpy order execution (Q4 misses are habit); tax surprises (FY26’s 98% rate); payment delays (debtor cycle eats cash); concentration risk (₹293 Cr order = 62% of FY26 revenue). |
A balance sheet with nothing to hide, a multiple with everything to prove, and a 12-month order pipeline that reads like fiction. The company built factories expecting a surge; the surge has orders but not yet earnings. Patient capital meets an impatient market.
