1. At a Glance
Meet Meghna Infracon Infrastructure Ltd (MIIL) — the company that started out trading shares, then thought “brokering is boring,” and pivoted into building real estate projects and running hotels. With a P/E ratio of143, this firm is basically priced like it’s the next DLF but operates like it’s still doing side hustles in Goregaon. Revenues are shrinking, but profits are ballooning — a classic case of “less sales, more swag.” Oh, and they just doubled equity through a1:1 bonus issue. Because if fundamentals don’t excite investors, free shares always will.
2. Introduction
Every Bollywood success story has that classic twist — the outsider arrives in Mumbai, hustles in Goregaon, and suddenly claims a stake in Andheri West. Meghna Infracon has chosen the same script.
Born in 2007 as Naysaa Securities, the company’s early career involved dabbling in share trading. But like any good millennial, it got bored quickly, reinvented itself, and moved into real estate development. To their credit, one of their projects — Ashraya Heights — was completed15 months before schedule. This is India; delivering a project on time is a miracle. Doing it ahead of time? That’s like finding Virat Kohli playing gully cricket in Borivali.
Fast-forward to FY25, the company is juggling multiple Goregaon projects, an Andheri launch, and something called “RIVIER” (yes, not “Riviera,” but “RIVIER” — because apparently vowels are overrated).
But here’s where the plot thickens: despite a top line that crashed 25% YoY, net profits skyrocketed 191%. How? Simple: they stopped spending too much. When your margins suddenly jump from 2.6% to over 30%, you know someone fired the caterer and the event suddenly became profitable.
Add in a shareholding reshuffle (FIIs quietly sneaking in with 7.26%), a name change, bonus issues, and CFO-musical-chairs, and you’ve got all the masala of a proper Dalal Street drama.
3. Business Model (WTF Do They Even Do?)
Once upon a time, MIIL bought and sold stocks. Then someone in the boardroom probably said,“Guys, enough with this trading nonsense, let’s build towers instead.”
Today, they’re real estate developers, primarily focused on Mumbai residential projects:
- Completed: Ashraya Heights, Goregaon (ahead of time, clap clap).
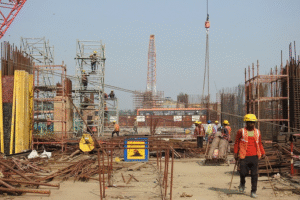
- Ongoing: Rivaan, Siddhanth Nagar, Manju Villa. If you’ve ever visited Goregaon West, you’ve probably seen more real estate hoardings than actual roads — Meghna’s billboards are part of that ecosystem.
- Upcoming: A premium residential project in Andheri West, plus RIVIER in Goregaon West.
And what about the hotel business? That seems to be less “Taj Mahal Palace” and
more “nobody knows.” The revenue split tells the truth:96% from share sales, 4% from F&O trading in FY24. Yes, you read that right — this “real estate company” still makes most of its money from trading securities. Builders by press release, traders by P&L.
4. Financials Overview
Here’s the quarterly report card — spoiler: sales are down, but net profit looks surprisingly fit for Instagram reels.
| Metric | Q1 FY26 (Jun 25) | Q1 FY25 (Jun 24) | Q4 FY25 (Mar 25) | YoY % | QoQ % |
|---|---|---|---|---|---|
| Revenue (₹ Cr) | 10.47 | 14.50 | 12.12 | -27.8% | -13.6% |
| EBITDA (₹ Cr) | 2.05 | 2.09 | 3.79 | -1.9% | -45.9% |
| PAT (₹ Cr) | 1.53 | 1.78 | 4.15 | -13.7% | -63.1% |
| EPS (₹) | 0.64 | 0.74 | 1.81 | -13.5% | -64.6% |
| EPS Annualised | 2.56 | 2.96 | 7.24 | -13.5% | -64.6% |
Commentary:
- Revenue fell harder than Bollywood box office after COVID.
- EBITDA and PAT both tanked QoQ, meaning cost savings aren’t enough anymore.
- Annualised EPS is weak at ₹2.56, giving a P/E of226xat CMP ₹580. That’s not “premium pricing,” that’s “out of syllabus question in exam.”
5. Valuation (Fair Value RANGE only)
Let’s sanity check this circus using three methods:
a) P/E Method
- EPS (annualised Q1 FY26): ₹2.56
- Industry P/E (Realty peers median): ~40
- FV = 2.56 × 40 =₹102
b) EV/EBITDA Method
- EBITDA TTM: ~₹11.3 Cr
- EV: ₹1,263 Cr
- EV/EBITDA = ~112x vs industry average 25x
- If normalised → FV = (11.3 × 25) ÷ 2.17 Cr shares ≈₹130
c) DCF (very rough)
- Assume profits grow 20% for 5 years (already a stretch).
- Fair range ~₹120–₹150.
👉Fair Value Range: ₹100 – ₹150(vs CMP ₹580).Disclaimer:This FV range is for
