KNR Constructions (FY26): From Order Drought to Asset Monetisation
General information and entertainment, not investment advice. The author is not a SEBI-registered adviser or research analyst. No recommendation, no promised returns. Markets carry risk including loss of capital. Figures may not be current. Consult a registered adviser before acting.
1. At a Glance
FY26: revenues collapsed 43% to ₹2,698 Cr, net profit halved to ₹437 Cr, EPS fell 57% to ₹15.54. Margin compressed from 34% to 26%.
The company is selling HAM stakes (₹1,543 Cr proceeds) and pivoting into mining and data centers. Working capital spiked to 345 days. Stock at 0.68x book, P/E 7.58, ROCE 10.4%.
Execution track record intact; margins and order visibility collapsed.
2. Introduction
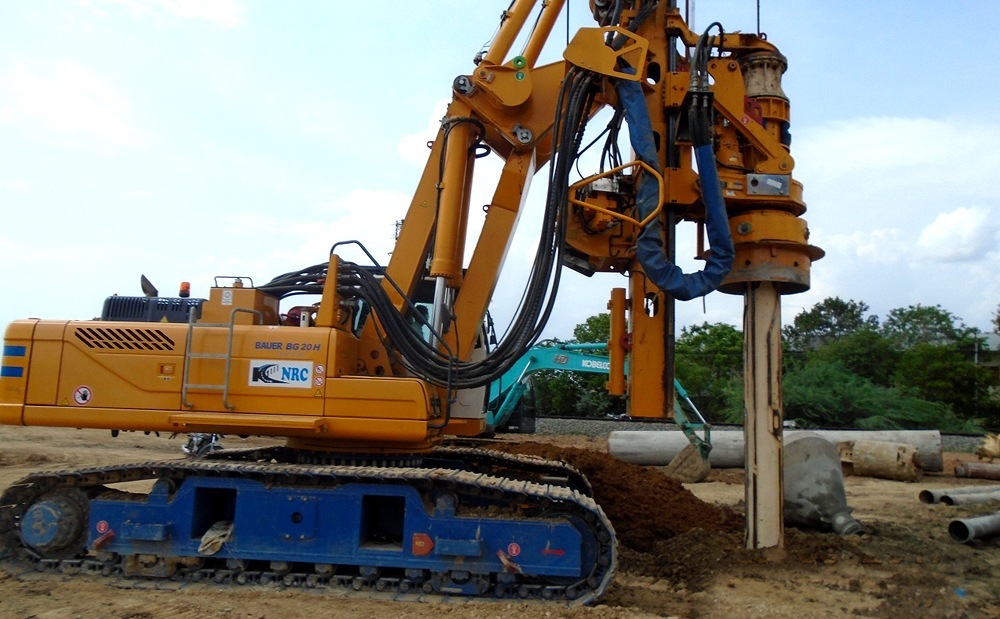
KNR Constructions was built in 1995 as a Hyderabad-based EPC player in highways, irrigation, and urban infrastructure. By FY25, it had executed 81 projects across 11 states with a reputation for early completions.
The turn came when NHAI awards slowed dramatically in FY26 (3,100 km awarded vs. 7,500 km target). Without new order inflow, overheads became a burden. Debtor days climbed to 109. Working capital swung sharply negative. Management opted to monetise HAM assets (selling four SPVs to Indus Infra Trust) and recapitalise to fund mining and new bids.
3. Business Model: WTF Do They Even Do?
KNR bids for EPC contracts in highways (flyovers, bridges), irrigation, and now mining and data centers. It owns 1,218 tippers, 373 excavators, and mixing plants. Eight HAM projects across Telangana and Karnataka (452 lane km) generate annuity cash once operational.
The EPC business is brutal: intense competition, 10% EBITDA margins (vs. historical 26%), working capital intensity, and chronic state payment delays. Telangana irrigation alone owes ₹1,400 Cr.
New pivots (mining, data centers) are unproven. Mining capex ₹350 Cr is gated by forest and Gram Sabha clearances. Data centers are greenfield with partners; “Indian data in India” policy post-2027 is the thesis, but land and power access are real gatekeepers.
Model in transition: core EPC business fighting for margin, asset monetisation unlocking liquidity, two unproven pivots beginning. Execution risk elevated.
4. Financials Overview
Figures are consolidated, in ₹ crore.
Metric
Q4 FY26
YoY
QoQ (from Q3)
Revenue
696
-29%
-6%
EBITDA
169
(calc)
(calc)
PAT
106
(calc)
(calc)
EPS
3.78
(calc)
(calc)
Metric
FY26
FY25
FY24
Revenue
2,698
4,753
4,429
EBITDA
711
1,610
1,049
PAT
437
1,002
752
EPS
15.54
35.62
27.64
EBITDA Margin %
26%
34%
24%
The headline: FY26 topline fell 43% YoY and 39% over three years. Earnings declined even faster—net profit down 56% from FY25’s ₹1,002 Cr to ₹437 Cr.
The company reported ₹162.97 Cr in claims and adjusted cost recoveries (net ₹27 Cr recognized in revenue per concall disclosures), so underlying operational performance is slightly softer than reported.
Management Guidance (Concall, 1 June 2026):
Management was unusually non-committal on FY27 revenue (“First time, we are unable to say”), citing uncertainties in HAM appointed dates and land-readiness for irrigation. Still, they aimed to “touch around 2,000 plus” in FY27. FY28 guidance was ₹3,000+ Cr, backed by the two new HAM projects (₹1,000–1,200 Cr combined execution) and mining ramp (₹350–400 Cr potential).
Margin guidance reset to 10–11% EBITDA (down from 26%) “because of the big gap that has come in NHAI.” Competition has intensified, management stated bluntly: “the market is entirely changed… very low levels” of bidding appetite.
Operating cash flow turned negative (₹–149 Cr), driven by working capital swing and claims settlement timing. Investing cash flow was also negative (₹–139 Cr), reflecting HAM capex and mining preparation. Financing CF was positive (₹371 Cr), including the asset monetisation proceeds.
5. Market Expectations & Historical Multiples
This section describes how the market is currently pricing the company and how that compares with its own history and peer group. It is descriptive, not predictive.