General information and entertainment, not investment advice. The author is not a SEBI-registered adviser or research analyst. No recommendation, no promised returns. Markets carry risk including loss of capital. Figures may not be current. Consult a registered adviser before acting.
1. At a Glance
FY26 revenue grew 15%, hitting ₹2,093 crore. That’s the good news.
Profit after tax came in at ₹336 crore, an underwhelming 6% rise year-on-year. Operating profit stood at ₹527 crore. The issue: consolidated earnings were dragged down by ₹67 crore in deferred revenue at the France subsidiary (Huron) due to export-license delays tied to a French investigation. Standalone (India core), profit grew 20%.
The company ran installed capacity at over 100% utilization for peak months. That’s a bottleneck masquerading as a problem solved. Management is bringing 10,000 additional machines per year online by September 2026—a near doubling of capacity from 6,000 to 16,000 units.
The order book swelled to ₹4,732 crore as of year-end, representing roughly 18–20 months of delivery visibility. 62.5% promoter ownership. No dividend. Price referenced is ₹640, at which the stock trades at 43.3× trailing earnings.
One tension worth watching: Can management execute a 2.7× capacity scale-up without margin dilution while the export investigation shadows Huron’s recovery timeline?
2. Introduction
Jyoti CNC Automation, headquartered in Rajkot, Gujarat, is a capital-goods manufacturer. It designs and builds 5-axis CNC machines—precision metal-cutting tools used in aerospace, defense, automotive components, general engineering, and specialized industries. The company holds a 10–12% domestic market share and has shipped machines to over 60 countries.
The story for the past two years: a sharp operational inflection from margin recovery to capacity constraint. FY24 marked a turnaround (PAT ₹151 crore after years of losses). FY25 momentum accelerated (PAT ₹316 crore, +110% YoY). FY26 saw demand remain robust but the execution ceiling hit hard.
In November 2024, the company announced a ₹400 crore capex to expand manufacturing by 10,000 machines annually at Metoda, Rajkot. Expected to be operational by Q2 FY27 (September 2026). This expansion is the centerpiece of management guidance and the lynchpin of FY27 revenue and margin narrative.
Recent headwinds include an April 2026 disclosure: French authorities launched an investigation into Huron Graffenstaden SAS (Jyoti’s stepdown subsidiary in Strasbourg) regarding export controls and dual-use machinery documentation. EUR 4 million in bank accounts and two properties were seized. The company has retained legal counsel. No timeline for resolution has been provided.
3. Business Model: WTF Do They Even Do?
Jyoti makes CNC machines. Not all CNC machines—it specializes in high-precision, high-end simultaneous 5-axis machining centers. These are platforms where a cutting tool can move in five directions at once, enabling complex geometries in a single setup. Airframe parts, engine components, aerospace fasteners, automotive gearboxes, and die molds are the sweet spots.
The product portfolio spans 44 verticals and 200+ variants. Entry-level machines start around ₹50 lakh per unit. High-end aerospace-grade systems command ₹2 crore or more. In FY26, approximately 40% of the order book was high-end (aerospace-heavy); 60% was entry- and mid-level (auto, general engineering, EMS).
Manufacturing happens at two facilities in Rajkot (India) and one in Strasbourg, France (Huron). Current capacity is 6,000 machines annually in India, 121 in France. The company has installed over 130,000 machines globally since inception.
Revenue mix:
FY26 saw aerospace jump to 38% of order-book intake (up from 8% in FY22). This is a structural reorientation—geopolitical defense capex, commercial aircraft orders, and the “Atmanirbhar Bharat” manufacturing push driving it. Auto and auto components fell to 20% of order book. General engineering represents 19%. EMS (electronics manufacturing services) emerged as 4%.
Geography: Exports now account for 45% of business (H1 FY25), up from 17% in FY22. That diversification is real, but it also ties revenue to the Huron facility and, now, to the export-control investigation.
Margins: The company operates on a 25% EBITDA target (pre-exceptional items). FY26 consolidated EBITDA margin was 25.2% on ₹2,093 crore revenue. Standalone (India), EBITDA margin was 28.9%, implying Huron’s mix or tax drag compresses consolidated margin by 3.7 percentage points.
Spare parts and after-sale services account for ~7% of revenue, a stickier, higher-margin segment that also builds customer lifetime value.
4. Financials Overview
Figures are consolidated, in ₹ crore.
| Metric | FY26 | FY25 | YoY Change | FY24 | FY25 vs FY24 |
|---|---|---|---|---|---|
| Revenue | 2093 | 1818 | +15.1% | 1338 | +35.9% |
| EBITDA | 527 | 491 | +7.3% | 301 | +63.1% |
| PAT | 336 | 316 | +6.3% | 151 | +109.3% |
| EPS (Reported) | 14.77 | 13.90 | +6.3% | 6.63 | +109.5% |
Q4 FY26 (Dec 2025 – Mar 2026) Highlights
Revenue came in at ₹599 crore (+4.1% QoQ, +4.1% YoY). Operating profit was ₹147 crore (24.6% margin). PAT hit ₹91 crore (15.2% margin).
Management attributed the Q4 slowdown to two factors: (1) capacity constraints that “impacted our ability to fully execute orders”; and (2) the ₹67 crore revenue deferment at Huron due to export-license holds on certain machines.
Standalone (India Business) Performance
Q4 standalone revenue reached ₹599 crore (+13% YoY). EBITDA margin expanded to 31.9% (₹191 crore). PAT grew to ₹135 crore (+22.6% margin).
The India-only numbers show a healthier operational picture: margins are wider, growth is faster. This is the core business humming. Consolidated results are being dampened by Huron’s accounting adjustment and likely higher capex-related amortization.
Concall Clarifications (May 2026)
Management stated the ₹67 crore deferment is “not a write-off… just a deferment.” Revenue will be recognized once export licenses clear. The costs have already been incurred, hence the margin compression in Q4 consolidated results. No loss of orders, management asserted; just timing.
Regarding FY26 growth having moderated to 6% on a reported basis despite strong demand: management blamed order-booking discipline. “We have been considerate in the order booking to match our delivery obligations,” implying throttled intake to protect delivery commitments while capacity-constrained.
5. Market Expectations & Historical Multiples
This section describes how the market is currently pricing the company and how that compares with its own history and peer group. It is descriptive, not predictive.
| Metric | Current (June 2026) | 5-Yr Average | Peer Median |
|---|---|---|---|
| P/E | 43.3 | 76.1 | 30.8 |
| EV/EBITDA | 26.0 | — | — |
| P/B | 7.27 | — | 3.79 |
| ROE | 18.2% | 17.5% | 11.52% |
| ROCE | 21.3% | — | 14.38% |
The stock currently trades at 43.3× consolidated earnings. The peer median sits at 30.8×. Jyoti commands a 40% premium to peers despite lower absolute size (₹2,093 crore revenue vs. peer medians of ₹236 crore). That premium appears anchored to the company’s ROCE (21.3%, above peer median) and ROE (18.2%, also above) alongside near-term capacity ramp visibility.
Historically, the stock has traded at a 5-year average P/E of 76.1×, suggesting the current 43.3× is a marked compression from earlier valuations when growth was less certain. Book value stands at ₹88 per share (face value ₹2), implying the stock trades at 7.27× book, above its peer median of 3.79× but below earlier years.
The market appears to be pricing in capacity-constrained earnings recovery, a meaningful margin floor, and successful ramp-up to 16,000 machines without significant dilution. Early-stage macro uncertainty (tariff chatter, West Asia conflict, energy volatility) is likely being reflected in the multiple discount from historical highs.
6. What’s Cooking
Export Probe at Huron (April 2026) — French authorities initiated investigation into Huron Graffenstaden SAS regarding export controls and dual-use machinery documentation. EUR 4 million in accounts and two residential properties seized. General manager suspended as “standard protocol.” Management states operations continue unaffected and expects eventual license clearance, but resolution timeline is undefined (“2, 3, 5 years”). Material because Huron contributed ₹248 crore revenue in FY26 and is expected to scale to ₹300–350 crore in FY27.
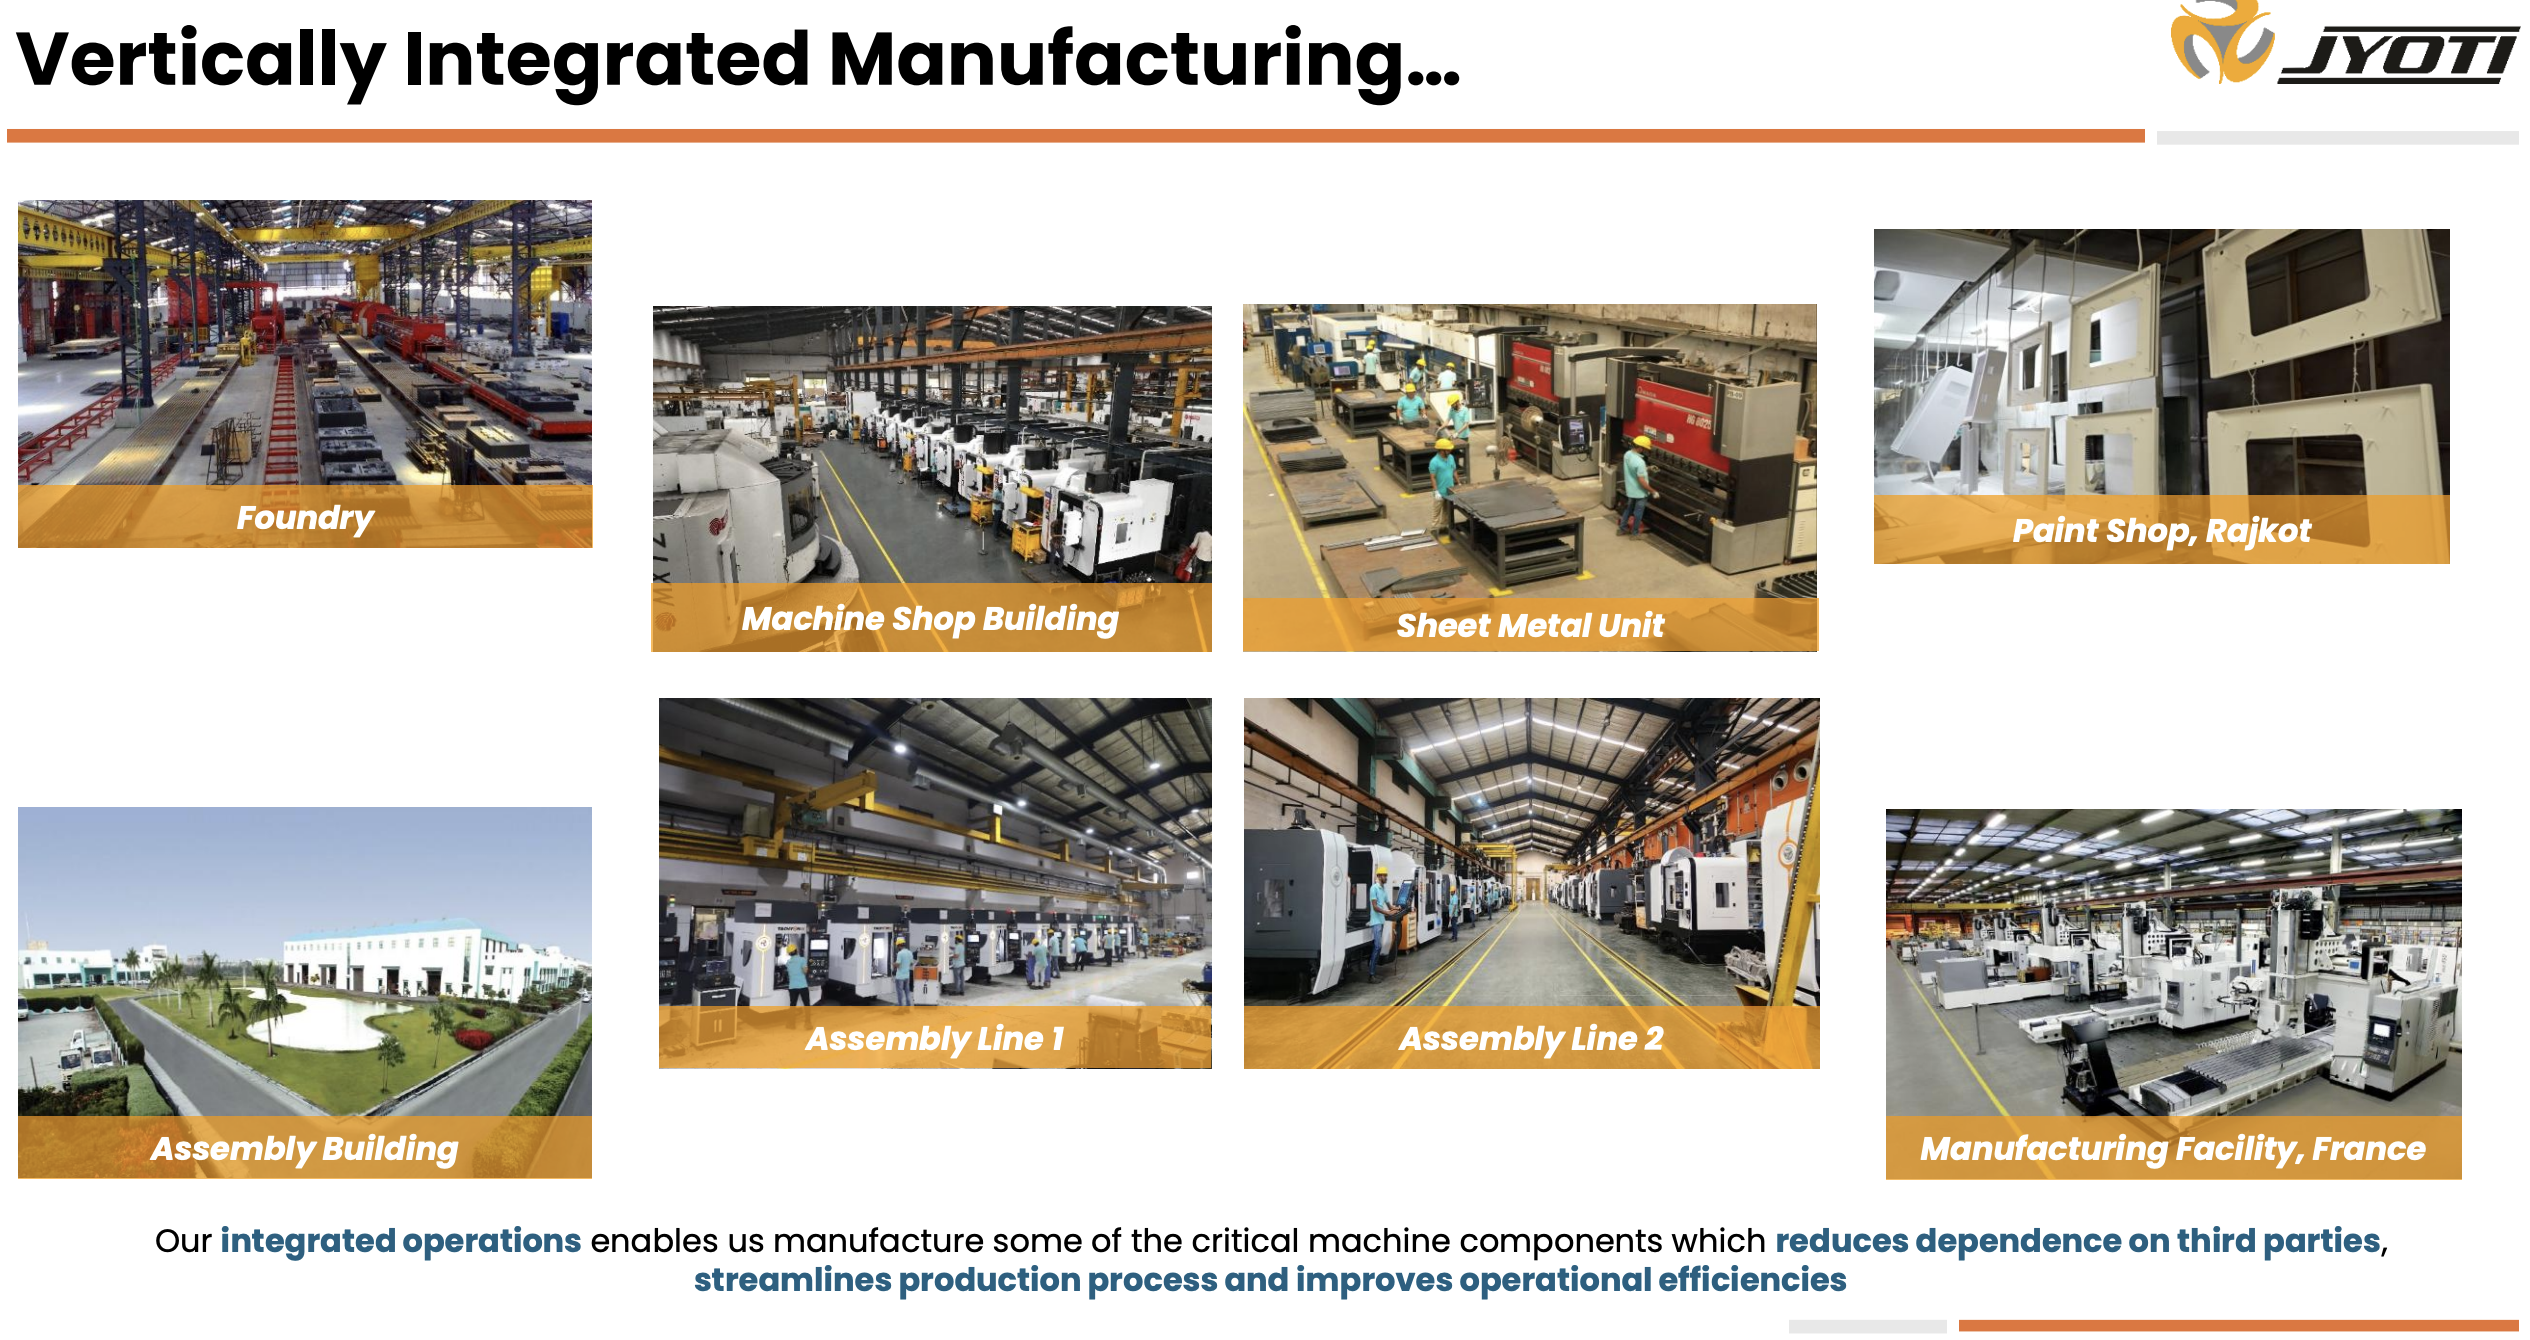
Capacity Expansion to 16,000 Units (Commissioned Sept 2026) — ₹400 crore capex to add 10,000 machines/year at Metoda, Rajkot. Management has been pre-hiring and training labor for 18 months. Expected to achieve 20–30% speed-up in throughput immediately post-commissioning. This is the central operational unlock for FY27 delivery growth.
Order Book ₹4,732 Crore (Mar 31, 2026) — 18–20 months of delivery visibility at current execution rates. Mix: 38% aerospace/defense, 20% auto/components, 19% general engineering, 4% EMS, balance others. Management noted “good orders from European areas including Ukraine” and “orders from French government.”
CGST Appeal Won (May 31, 2026) — Company had faced ₹4.46 crore CGST demand. Appeal allowed; demand set aside and company eligible for refund. Regulatory win, small magnitude.
TDS Compounding Penalty (Aug 2025) — ₹9.07 crore TDS compounding charges disclosed for earlier-period delays. This was a non-cash drag historically and reflects administrative issues, now resolved via compounding.
Independent Director Resignation (Oct 26, 2025) — Prasad Parameswaranpillai Naga resigned. No stated reason; classified as routine governance churn.
Standalone Margins Outpacing Consolidated (FY26) — Standalone EBITDA 28.9%, consolidated 25.2%. This 3.7-point gap narrows as Huron improves, suggesting the India business is running cleaner than the consolidated average.
7. Balance Sheet
| Item | FY24 | FY25 | FY26 |
|---|---|---|---|
| Total Assets | 2,178 | 2,792 | 3,615 |
| Equity (Capital + Reserves) | 1,365 | 1,686 | 2,001 |
| Borrowings | 304 | 497 | 853 |
| Other Liabilities | 510 | 609 | 761 |
| Total Liabilities | 2,178 | 2,792 | 3,615 |
Validation: Assets = Liabilities in all periods. ✓
The balance sheet has inflated 66% in two years (₹2,178 cr in FY24 to ₹3,615 cr in FY26). Borrowings tripled from ₹304 cr to ₹853 cr. But equity also grew 47%, from ₹1,365 cr to ₹2,001 cr, powered by retained earnings. The debt-to-equity ratio widened from 0.22× to 0.43×—still conservative, but trending upward.
Mechanics:
Capital work in progress (CWIP) grew from ₹58 cr (FY24) to ₹184 cr (FY25) to ₹89 cr (FY26). The sharp drop in FY26 suggests the new 10,000-unit facility began final stages of capex (moving from CWIP to fixed assets or slowing spend in advance of commissioning).
Fixed assets (net block) jumped from ₹322 cr (FY24) to ₹746 cr (FY26), reflecting asset-heavy manufacturing expansion.
Receivables ballooned from ₹249 cr (FY24) to ₹599 cr (FY26). This is working-capital drag tied to a long manufacturing cycle (average debtor days: 104). Inventory also swelled from ₹866 cr to ₹1,166 cr. Combined, these tie up ₹1,765 cr in working capital—a structural feature of CNC machine manufacturing, not a sign of distress, but a cash-conversion headwind.
Three Observations:
- The company is buying growth with leverage. Debt jumped ₹553 cr in two years. If FY27 capacity ramp stalls or demand softens, cash conversion becomes critical. Management expects post-commissioning CFO improvement, but this is forward guidance, not history.
- Equity cushion is adequate but tightening. D/E at 0.43× is manageable for a manufacturing business with ₹21.3% ROCE, but it’s no longer the fortress balance sheet of FY22–FY24. Every percentage point of margin miss now hits leverage and debt-service headroom harder.
- Working capital intensity is rising. Debtor days moved from 68 (FY24) to 104 (FY26). This is order-book composition (bigger aerospace orders = longer payment terms). Management expects compression post-ramp, but larger order values often mean larger receivables cycles, not shorter ones. Risk signal worth monitoring.
Net Cash Position: Cash and bank balances stood at ₹137 crore (FY26). Borrowings at ₹853 crore. Net debt: ₹716 crore, or 1.35× FY26 EBITDA. Serviceable, but not a comfortable cushion.
8. Cash Flow: Sab Number Game Hai
| Year | Operating | Investing | Financing |
|---|---|---|---|
| FY24 | -48 | -170 | 505 |
| FY25 | -105 | -329 | 145 |
| FY26 | 54 | -302 | 287 |
The Arc:
FY24 and FY25 saw negative operating cash flow: -₹48 cr and -₹105 cr respectively. These were capex ramp years. Working capital expanded (inventory, receivables) faster than cash from operations, creating a deficit.
FY26 swung to +₹54 cr operating CFO. That’s progress, though still modest relative to ₹336 cr net profit. The swing reflects timing of collections and payables, not necessarily improved working-capital discipline.
Investing activity remained negative: -₹302 cr in FY26 (down from -₹329 cr in FY25), driven by the ₹400 crore capex program for the new facility. That spend is still ongoing; expect continued capex drag through Q2 FY27.
Financing cash inflow of ₹287 cr in FY26 (down from ₹505 cr in FY24) reflects the debt raise to fund capex.
The Tension:
Management’s concall commentary hinted at expecting “very robust cash flows… quarter on quarter” post-commissioning. That’s aspirational. History says CNC machine manufacturers with expanding capacity and long receivables cycles take 2–3 years to convert capacity growth into FCF growth. Working capital will likely remain a headwind.
9. Ratios: Sexy or Stressy?
| Ratio | FY26 | FY25 | FY24 |
|---|---|---|---|
| ROE | 18.2% | 20.0% | 19.8% |
| ROCE | 21.3% | 24.0% | 21.0% |
| P/E | 43.3 | — | — |
| PAT Margin | 16.0% | 17.4% | 11.3% |
| D/E | 0.43 | 0.29 | 0.22 |
ROE at 18.2% — The equity is earning a middle-of-the-road return relative to cost of capital for an industrial manufacturer (typically 10–12% WACC). It’s respectable, not exceptional. The compression from 20% (FY25) suggests the equity base grew faster than profits in FY26—a dilution effect from the capex cycle. Post-ramp (assuming no margin collapse), expect ROE to re-expand.
ROCE at 21.3% — Capital employed is generating 21% returns, above the company’s cost of capital and above peer median (14.4%). This is the hallmark of a quality business. But the trend dipped from 24% (FY25), again due to expanding asset base ahead of revenue scaling. FY27 will be the test: if capacity ramp materializes and margins hold at 25%, ROCE will re-accelerate.
PAT Margin at 16% — Down from 17.4% in FY25 and massively above FY24 (11.3%). The margin is healthy, but the sequential compression hints at saturation and mix effects. Aerospace orders (higher-end, lower volume, better margins) are growing but still offset by general engineering and entry-level order growth (higher volume, tighter margins). The 25% EBITDA floor management guided implies the operating leverage is preserved; tax and interest are the marginal offsets.
D/E at 0.43 — Still manageable, but the trajectory is trending higher. At 0.43×, interest coverage (calculated from concall: 10.95× on 9M FY26) remains strong. The risk is not immediate but conditional: if margin degrades below 23% EBITDA or capex extends, D/E could spike to 0.55–0.60×, where covenant headroom tightens.
10. P&L Breakdown: Show Me the Money
| Year | Revenue | EBITDA | PAT |
|---|---|---|---|
| FY24 | 1338 | 301 | 151 |
| FY25 | 1818 | 491 | 316 |
| FY26 | 2093 | 527 | 336 |
The Trajectory:
Revenue grew 35.9% in FY25, then decelerated to 15.1% in FY26. This is neither a surprise nor a red flag. Management deliberately throttled order bookings to match delivery capacity. The company is not chasing revenue; it’s protecting execution credibility.
EBITDA grew 63% in FY25 (margin expansion), then slowed to 7% in FY26 (margin compression on account of Huron deferment and capex-related amortization). Strip out the ₹67 cr Huron deferment and PAT would have landed closer to ₹403 cr—a 27% growth. That’s a material accounting timing issue, not an operational deterioration.
PAT growth of only 6% in FY26 feels weak relative to 15% revenue growth, but again, the Huron timing is the culprit. On a standalone basis, India PAT growth was 20%, better aligned with revenue. The consolidated drag is a one-time accounting event (management’s assertion) tied to the export investigation.
Profitability Profile:
The business has moved from marginal profitability (FY22: -₹48 cr PAT) to solidly profitable (FY26: ₹336 cr PAT) in four years. That’s a ₹384 cr swing, fueled by margin recovery (OPM from 10% in FY22 to 25% in FY26), scale, and operational discipline.
11. Peer Comparison
| Company | Revenue (₹cr) | PAT (₹cr) | P/E |
|---|---|---|---|
| Jyoti CNC | 2093 | 336 | 43.3 |
| Honeywell Auto | 4682 | 534 | 59.6 |
| Aditya Infotech | 4221 | 368 | 110.2 |
| Syrma SGS | 4819 | 321 | 73.6 |
| Kaynes Tech | 3626 | 366 | 56.3 |
| LMW | 3207 | 140 | 118.4 |
Size Positioning:
Jyoti is the smallest by revenue in this peer set. Honeywell Auto is 2.2× larger. But Jyoti’s profitability relative to size is stronger: ₹336 cr PAT on ₹2,093 cr revenue (16% margin) vs. Honeywell Auto’s ₹534 cr PAT on ₹4,682 cr revenue (11.4% margin).
Valuation Gap:
Jyoti trades at 43.3× earnings. Honeywell trades at 59.6×, Syrma at 73.6×, Kaynes at 56.3×. On this sample, Jyoti is the cheapest. But LMW (peer in machine tools) trades at 118.4× on thin profitability. The multiples are all elevated—a sector-wide phenomenon reflecting capital-goods tailwinds and geopolitical defense/manufacturing push.
Margin Comparison:
Jyoti’s 16% PAT margin exceeds Honeywell’s 11.4% and Kaynes’ 10.1%, but lags Aditya Infotech (8.7% is actually much lower; I misread the PAT/Revenue). Let me recalculate: Aditya Infotech, 368/4221 = 8.7%. Jyoti is clearly superior on margin. This supports the higher multiple, not contradicts it.
12. Miscellaneous: Shareholding & Promoters
| Holder | % |
|---|---|
| Promoters | 62.55 |
| FIIs | 8.95 |
| DIIs | 13.68 |
| Public | 14.82 |
Promoter Profile:
The core promoter group consists of Parakramsinh Ghanshyamsinh Jadeja (26.91%), Jyoti International LLP (16.16%), Anilkumar Bhikhabhai Virani (14.45%), and others. Together, they hold 62.55%. No pledges against holdings (as of Mar 2026). No recent changes in promoter ownership.
Parakramsinh Jadeja is the founder (founded the predecessor partnership in 1989, incorporated JCAL in 1991). He remains executive chairman. The family has kept the business for 35+ years and has not exited or diluted holdings meaningfully during the IPO (Jan 2023) or post-IPO. That’s credible skin-in-the-game.
FII / DII Drift:
FIIs have been modest sellers: 7.20% (Mar 2025) → 8.95% (Mar 2026) is a net increase, but the volatility through the year (peaked at 9.91% in Sep 2025) suggests light positioning. DIIs hold steadier at 13.68% and have been gradual accumulators. Public holding, post-IPO demand flush, has normalized to 14.82%.
One Small Roast:
Huron is a stepdown subsidiary, and the export investigation has fallen on that entity’s employees and officers, not directly on Jyoti’s. That legal/corporate structure is smart (limiting contagion), but it also reveals Jyoti has less direct operational control over Huron’s compliance apparatus. Acquisition integration and governance oversight are questions worth asking if the investigation lingers.
13. Corporate Governance: Angels or Devils?
Auditors: Deloitte Haskins & Sells LLP (FY26). No audit qualifications noted.
Board: The company operates with an 8-member board. Majority are non-executive, including 4 independent directors (as of latest disclosure). One independent director, Prasad Parameswaranpillai Naga, resigned in Oct 2025 without stated cause.
Pledges: None on promoter holdings.
Related-Party Transactions: Intercompany sales between Jyoti and Huron totaled ₹105 cr in FY26 (Huron supplies components to Jyoti). This is an internal transaction, eliminated in consolidation, but worth flagging: supply-chain concentration risk if Huron operations are disrupted by the investigation.
Tax Matters:
- CGST Appeal (May 2026): ₹4.46 cr demand set aside. Company eligible for refund. Regulatory win.
- TDS Compounding (Aug 2025): ₹9.07 cr penalty disclosed for earlier-period TDS delays. Non-cash, settled via compounding. Indicates administrative weaknesses circa FY23–FY24.
The Huron Probe (April 2026):
French authorities initiated investigation into Huron Graffenstaden SAS for export controls and dual-use machinery. No charges filed, but the general manager was suspended (described as “standard protocol”). EUR 4 million in accounts and two properties seized. Management has retained legal counsel. No timeline for resolution provided. Management states operations continue unaffected.
Red Flag Assessment: This is a red flag on timing and magnitude, not on the company’s ethical standing (management claims compliance, and absent evidence to the contrary, we note it as an investigation, not a conviction). The risk is operational (if Huron is restricted from exporting, FY27 guidance of ₹300–350 cr from Huron may not materialize) and liquidity (if resolution stretches 2–3 years, working-capital debt tied to Huron operations could be impaired). The company has disclosed transparently; shareholders are aware. Ongoing monitoring warranted.
14. Industry Roast & Macro Context
CNC Machine Tool Sector:
The sector is fragmented. Jyoti holds 10–12% of the domestic market. Competitors include international players (DMG Mori, Haas, Makino) with deeper pockets and global distribution, and smaller domestic players (LMW, Vickers, others) with niche positioning.
The pricing environment is competitive. Jyoti has pushed ASPs upward (from ₹33 lakh/machine in FY24 to ₹46 lakh in FY26) through product mix (more high-end aerospace orders), but volume growth is being achieved at constant or slightly lower ASPs. Management guided that at full ramp (16,000 machines), ASP could compress to ₹30 lakh while sustaining 25% EBITDA margin. That requires operational efficiency and is credible but not assured.
Raw Material Inflation:
Commodity costs rose 2–3% in FY25–FY26. The company largely sells on fixed prices (cannot pass through retroactively). Mitigation: repricing new orders (management raised prices from May 1, 2026 for new bookings). The long manufacturing cycle (8–14 months) provides a natural hedge: raw material costs at order-booking are baked in, newer bookings reflect updated inflation. But if commodity shocks accelerate, this hedge fails.
Labor Constraints:
Sector-wide issue. Jyoti and peers are pivoting toward automation features (remotely controlled, AI-assisted) to reduce headcount dependencies. Management noted this as a structural shift in demand. It’s both opportunity (Jyoti’s automation products) and risk (if automation features become table-stakes, margin competition intensifies).
Macro Headwinds:
Management’s concall flagged “tariff-related issues,” “West Asia conflict,” and “supply chain disruption.” These are real, but Jyoti’s export base (45% of sales) is less exposed to China or Russia trade-war spillovers than, say, auto component suppliers. Aerospace and EU demand (where Huron ships) is more stable, though the investigation adds uncertainty.
Atmanirbhar Bharat Push:
Government capex on defense manufacturing, infrastructure, and “Make in India” is a tailwind. Jyoti benefits from domestic defense procurement (HAL, DRDO) and the structural shift toward manufacturing hubs. This is a multi-year theme, not a quarterly blip.
15. EduInvesting Verdict
| Factor | Analysis |
|---|---|
| Strengths | Demonstrated turnaround from losses (FY22–FY24) to profitability; 21.3% ROCE above cost of capital; 10–12% domestic market share in a structural growth market; order book 18–20 months deep; management skin-in-the-game (62.5% promoter ownership); standalone margins (28.9% EBITDA) stronger than consolidated. |
| Weaknesses | Consolidated margin compressed by ₹67 cr Huron deferment; debt-to-equity rising (0.43×) to fund capex; working capital intensity increasing (debtor days 104, inventory days 453); no dividend despite strong profitability; capex execution risk on 10,000-unit expansion; small absolute size vs. global competitors. |
| Opportunities | Capacity expansion to 16,000 machines (67% increase) by Sept 2026; aerospace order-book momentum (38% of intake, up from 8% in FY22); FTA tailwinds (EU, US negotiations); export market still under-penetrated; automation products gaining traction. |
| Threats | Huron export investigation; unresolved timeline could delay 300–350 cr revenue contribution from France; tariff volatility and energy shocks; commodity inflation and limited retroactive pass-through; working-capital cash conversion delayed beyond current guidance; debt servicing pressure if FY27 capex ramp overshoots or demand softens. |
Closing Line:
A business that proved it could turn a loss into a 16% PAT margin over four years now faces the harder test: scaling 2.7× capacity without margin collapse, while a French legal probe shadows the asset that was supposed to anchor the international strategy. The order book is deep, the domestic tailwind is real, and management’s operational discipline is evident. But the next 18 months will compress five years of margin trust into a single execution cycle—one where working capital bleeds cash, debt rises further, and a subsidiary sits in investigative limbo. Investors are pricing in success; the company is betting it can deliver.
