JSW Cement FY26: The CCPS Parallel Universe, Greenfield Drama, and the ₹799 Cr Ghost in the P&L
Section 1 — At a Glance
JSW Cement’s FY26 financial scorecard is a striking study in structural contradictions, forcing analysts to separate operational reality from severe accounting noise. The headline performance shows a net loss of ₹756.32 crore for the fiscal year, a massive plunge into the red compared to a net profit of ₹89.81 crore in FY24. Yet, this bottom-line collapse is entirely decoupled from the company’s core operations. Driven by a massive, non-cash fair value charge of ₹1,466.4 crore triggered by the pre-IPO conversion of Compulsory Convertible Preference Shares (CCPS), the reported net profit functions as an accounting artifact rather than a sign of operational distress.
Operationally, the business experienced significant expansion. Driven by a 10.6% volume growth to 13.96 million metric tonnes (MMT), consolidated sales rose 12.0% year-on-year to ₹6,512.46 crore. Operating EBITDA grew 43.6% to ₹1,240.30 crore, pushing EBITDA per tonne up by ₹204 to ₹888. This operational surge was further supported by a massive ₹211.2 crore one-time deferred tax credit in Q4 FY26, as management elected to transition to India’s new tax regime starting in FY27.
Capital allocation remained aggressive, highlighted by the commercial launch of the 2.5 MTPA Nagaur plant in Rajasthan on March 30, 2026, marking the company’s official entry into the competitive North Indian market. Balance sheet leverage moderated significantly following an August 2025 IPO that injected ₹1,600 crore in fresh equity, allowing the company to reduce gross borrowings to ₹4,464.39 crore. True corporate earnings quality can only be evaluated by isolating core unit economics from non-operational balance sheet restructurings. We look next at the fundamental framework driving this multi-regional infrastructure play.
Section 2 — Introduction
JSW Cement Ltd has officially shed its status as an unlisted incubator project, arriving on the public bourses via its ₹3,600 crore initial public offering in August 2025. Belonging to the Sajjan Jindal-led JSW Group conglomerate, the company has grown into a multi-regional infrastructure supplier with an active grinding capacity of 24.10 MMTPA across eight manufacturing locations.
The corporate blueprint is designed around heavy capacity expansion. Management’s growth strategy focuses on doubling its total footprint to approximately 46 MMTPA, aiming to transform a regional player into a pan-India franchise. The recent commissioning of the integrated Nagaur unit in Rajasthan marks the launch of this northern push. This multi-billion crore capital investment cycle is playing out against volatile international fuel markets and logistical re-alignments, testing the execution capabilities of the infrastructure conglomerate.
Section 3 — Business Model: WTF Do They Even Do?
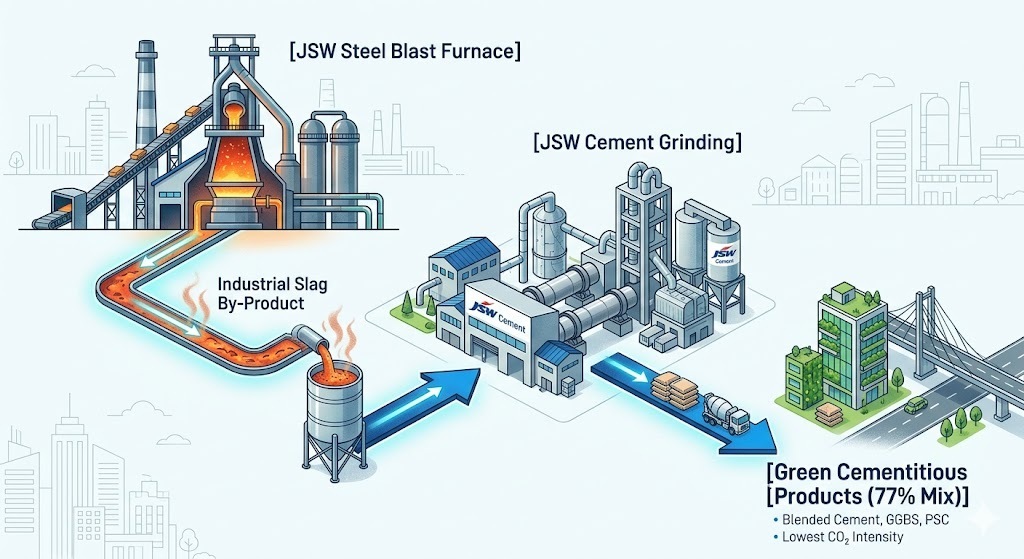
JSW Cement’s business model operates on industrial metabolism: they take the solid waste generated by their sister company’s steel blast furnaces and turn it into commercial building materials. The company operates as India’s single largest manufacturer of Ground Granulated Blast Furnace Slag (GGBS), controlling an estimated 84% national market share.
Instead of relying solely on traditional Ordinary Portland Cement (OPC), which requires mining and burning massive amounts of limestone, JSW blends blast furnace slag into its product mix. GGBS and blended Portland Slag Cement (PSC) make up 77% of total sales volumes. This circular loop gives the company a clinker-to-cement ratio of 51%—one of the lowest in the industry—which insulates it from soaring limestone and carbon costs. The raw material supply is secured via long-term contracts tied directly to JSW Steel’s production hubs. However, this leaves the company’s supply chain deeply linked to steel sector operating conditions, as any disruption in domestic steel output flows directly into JSW Cement’s raw material availability.
Section 4 — Financials Overview
Figures are consolidated, in ₹ crore.
Metric
Latest Quarter (Q4 FY26)
YoY Change (%)
QoQ Change (%)
Revenue
₹1,894.99
+10.9%
+16.9%
EBITDA / Operating Profit
₹365.07
+45.9%
+28.1%
PAT
₹371.33
+2,192.2%
+161.3%
Reported EPS
₹2.72
+1,913.3%
+161.5%
Topline growth is meaningless if it is consumed by un-capitalized commissioning expenses and logistical bottlenecks.
Did Management Walk the Talk?
During previous periods, management targeted rapid optimization of regional transport costs and a smooth