JK Cements Mar 2026: The ₹3,630 Cr Jaisalmer Gamble and the Paint Business Bleed
Section 1 — At a Glance
JK Cements closed its financial year 2026 with an intensive sprint in capital expenditure, reshaping its asset base while facing immediate structural and macroeconomic headwinds. The company reported consolidated revenue from operations of ₹13,722 crore for FY26, representing a growth of 15.5% over the previous year. However, this growth has come at a significant capital cost. Total borrowings climbed to ₹6,183 crore by March 2026, pushing the company’s net debt position to ₹3,370 crore despite holding cash and liquid equivalents of over ₹17.7 billion.
Investor focus remains divided between the company’s aggressive capacity execution and a notable compression in profitability margins. While full-year consolidated Profit After Tax (PAT) stood at ₹988 crore, the fourth quarter exposed structural vulnerabilities. Q4 FY26 consolidated PAT came in at ₹331 crore, marking a decline of 8.3% compared to the ₹361 crore reported in Q4 FY25. Operating margins are caught in a clear compression cycle, with Q4 margins shrinking to 17.8% from 22.1% in the corresponding previous period, heavily driven by an escalating geopolitical crisis in the Middle East that has upended fuel and logistics costs. Simultaneously, the company’s expensive foray into the decorative paints segment continues to dilute cash flows, recording a substantial operating loss.
When strategic expansion is heavily funded by leverage during a period of escalating input costs, the efficiency of capital absorption determines structural survival over cyclical growth.
As the company pushes forward with an ambitious blueprint to cross 30 MTPA of capacity, the immediate horizon depends entirely on its pricing power against regional supply additions and the structural stabilization of its non-cement diversifications.
Section 2 — Introduction
JK Cements Ltd, a prominent affiliate of the multi-disciplinary industrial conglomerate JK Organisation, enters 2026 as an industrial giant attempting to run two entirely different races at once. On one track, it is defending its position as an established top-10 grey cement manufacturer in India and the second-largest player in the structurally lucrative central region. On the other track, it is attempting a modern transformation, executing highly capital-intensive greenfield expansions while trying to forcefully cross-sell decorative paints through its legacy wall putty dealer network.
The strategic direction over the last twelve months has been defined by raw volume aggregation. Management has aggressively commissioned capacity across Central India, including grinding assets in Hamirpur and a major split grinding unit in Buxar, Bihar. Yet, this newly built manufacturing footprint faces its first real test as the broader cement industry enters a multi-year supply pipeline expansion wave, threatening realizations across its core northern and central strongholds.
Section 3 — Business Model: WTF Do They Even Do?
At its core, JK Cements acts as a massive molecular transformer that turns limestone, heat, and immense leverage into cash-generating building blocks. The business model is split into three core pillars:
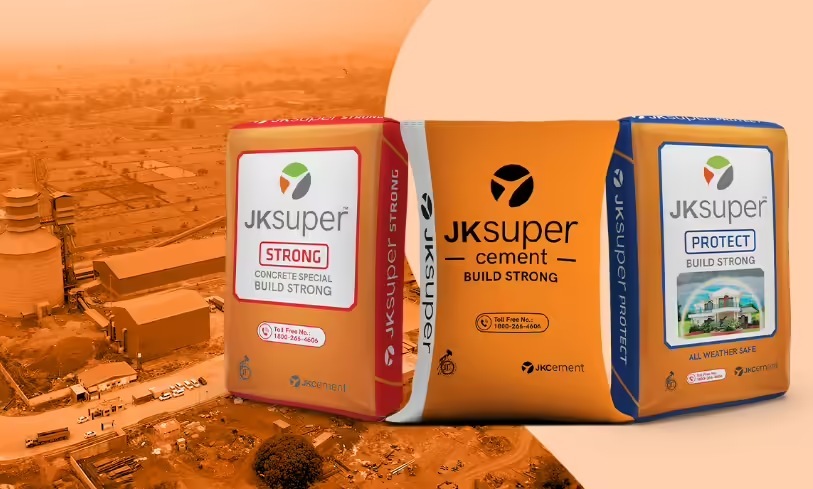
Grey Cement (~81% of Revenue): This is the high-volume commodity core operating under the “JK Super Cement” brand. It is a hyper-regional business where profit margins are determined entirely by logistics, proximity to limestone reserves, and how effectively you can supply core infrastructure and housing markets.
White Cement and Putty (~19% of Revenue): This is the premium margin anchor. JK Cements holds a global top-2 position here, enjoying exceptional brand equity with products like WallMaxX putty. It operates as a high-barrier ecosystem with superior realizations that effectively subsidizes the rest of the corporate operations.
Paints and Allied Products (Growing Segment): This is the experimental new engine. Operating under J.K. Maxx Paint, the company is attempting to leverage its legacy putty dealer network to cross-sell decorative paints, though it currently operates as a cash drain as it tries to break into a hyper-competitive market.
Section 4 — Financials Overview
Figures are consolidated, in ₹ crore.
Headline Performance Metrics
Metric
Latest Quarter (Mar 2026)
YoY
QoQ
Revenue from Operations
₹3,888
8.57%
12.27%
EBITDA
₹683
-10.72%
22.40%
PAT
₹331
-8.31%
19.19%
Reported EPS (₹)
₹43.10
-7.51%
90.71%
The financial performance presents a classic sequential recovery masked by persistent year-on-year structural pain. Revenue for the quarter rose to ₹3,888 crore, displaying an energetic 12.27% jump over the preceding winter quarter as construction activity hit peak seasonal momentum. EBITDA followed with a 22.40% sequential surge to ₹683 crore.
However, the real story emerges when comparing these numbers to the previous year. EBITDA compressed by more than 10% year-on-year, and margins shed 430 basis points to settle at 17.8%. Volume growth is clearly keeping the lights on, but the profitability per bag is fighting a brutal losing battle against rising input line items.
What is Management Promising in the Coming Quarters?
During the May 2026 earnings interaction, management expressed a structural confidence that can be described as unyielding. The CEO noted that they expect double-digit volume growth to persist into FY27, targeting an incremental 2.5 million tonnes of volume.
On the pricing front, management highlighted an initial pricing pass-through executed in April, which added roughly ₹10 per bag across major markets. They