General information and entertainment, not investment advice. The author is not a SEBI-registered adviser or research analyst. No recommendation, no promised returns. Markets carry risk including loss of capital. Figures may not be current. Consult a registered adviser before acting.
1. At a Glance
The company recorded consolidated net profit of ₹169.27 crore in FY26, up 155% from ₹66.54 crore in FY25 — a jump so steep it demands skepticism. Revenue, however, stayed flat at ₹514.34 crore versus ₹517.70 crore a year prior. The company paid no dividend this year despite the profit spike. A ₹150 crore jolt of other income — mostly from holding long-dated financial assets — inflated the bottom line far more than operations did. Plastic processing, which accounts for 98% of segment revenue, shrunk 1% year-on-year. Meanwhile, a subsidiary underwent ED investigation in December 2025, freezing ~₹99 crore of its assets.
2. Introduction
Jai Corp, incorporated in 1985, manufactures plastic products (woven sacks, jumbo bags, staple fiber, geotextiles), trades galvanized steel, and develops land through subsidiaries near Mumbai. The company trades on BSE (512237) and NSE (JAICORPLTD) with a market cap of ₹1,979 crore as of the reference price date.
FY26 saw a board-approved dividend of ₹0.50 per share after the year closed, sharply lower than the ₹8.92 crore paid out the prior year. The board also faced a qualified audit opinion on consolidated results due to two matters: a ₹2,147 lakh intercorporate deposit overdue and owed by a subsidiary (no provision taken; legal proceedings ongoing), and missing financial data from one associate company. A smaller subsidiary (Urban Infrastructure Venture Capital) had ED-frozen assets flagged as a separate emphasis note.
3. Business Model: WTF Do They Even Do?
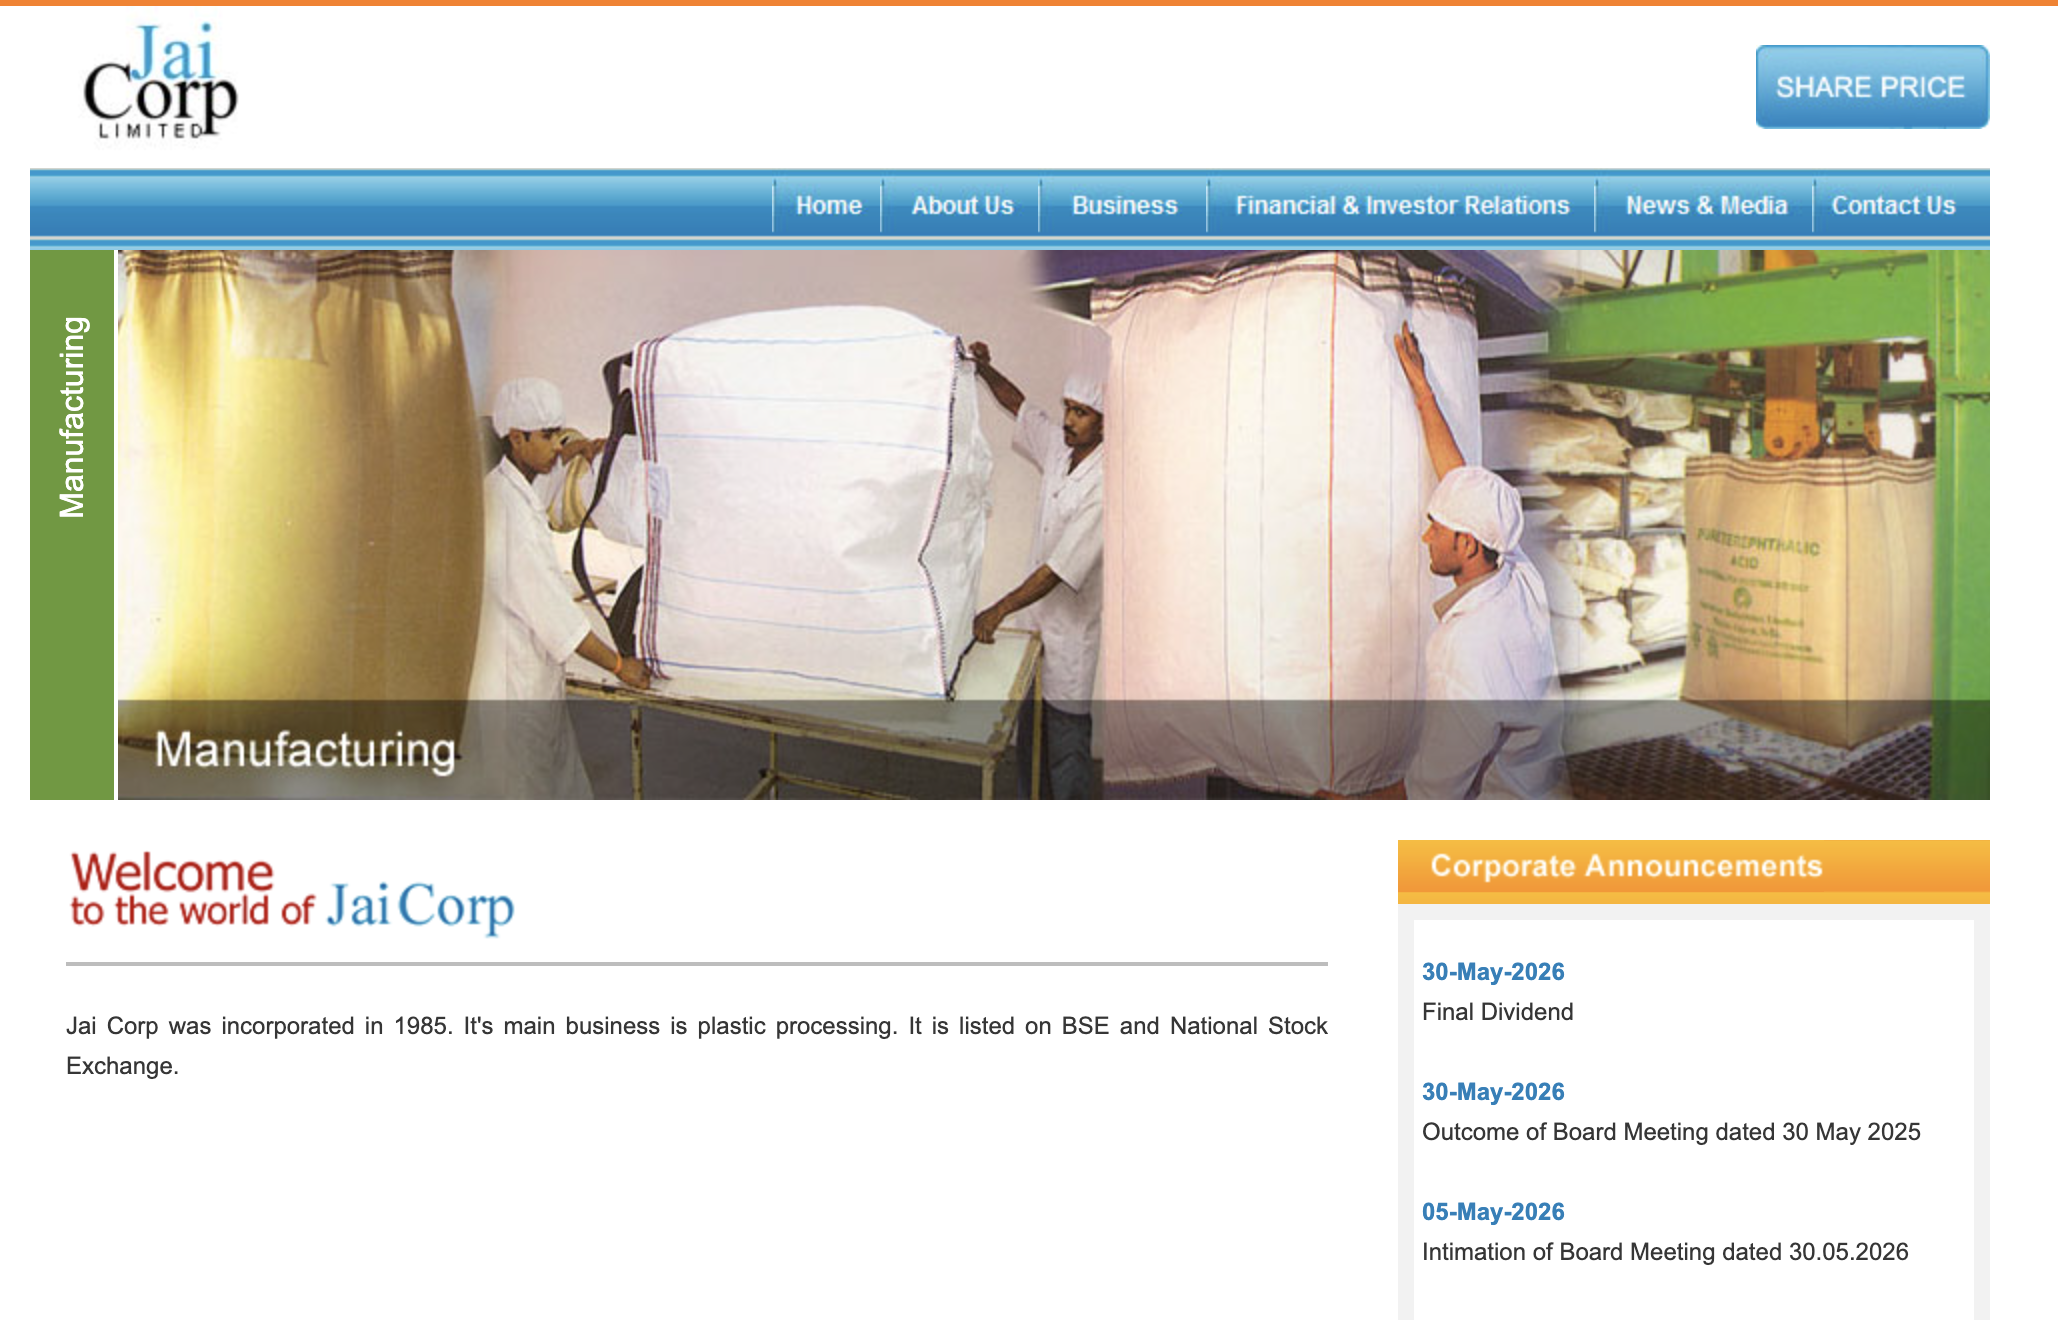
Plastic Processing. The division produces woven polypropylene sacks/fabric, jumbo bags, staple fiber, and geotextiles. Production volumes fell to 39,425 MT in FY25 from 42,501 MT in FY22 — a 7% slide. The segment earned ₹50.39 crore revenue in FY26 off 98% of total sales. A single customer accounts for 86% of plastic division revenue. Yes, one buyer underwrites the whole operation. That customer’s purchasing appetite dictates whether Jai Corp’s revenue rises or falls. The geographic mix skews India-heavy (91% of FY24 sales), with USA at 5% and others 4%.
Steel — on life support. The division produced galvanized steel as job work and traded CR/GP/GC coils. Production collapsed to zero MT in FY24 from 8,512 MT in FY22. A ₹30 lakh loss in FY26 confirms the unit is a zombie. No inventory, minimal capex, no future roadmap.
Real Estate & Infrastructure. Via 21 wholly-owned subsidiaries, the company develops SEZs and industrial estates near Mumbai. Projects include phases of an industrial estate near Navi Mumbai (completed and being sold), co-promoted SEZs with Reliance, and a port project (Rewas Ports) that has stalled on right-of-way disputes. These are capital-heavy, lumpy ventures. Real estate contributed ₹1,047 lakh consolidated revenue in FY26.
Spinning — discontinued. The Board phased out yarn production in mid-2020. Assets are held for sale; no material impact expected on FY26 onwards.
The business is concentrated, slow-growth, and wedged between a monopoly customer and real-estate bets that show no traction.
4. Financials Overview
Figures are consolidated, in ₹ crore, annual basis.
| Metric | Latest (FY26) | YoY Change | FY25 |
|---|---|---|---|
| Revenue | 514.34 | -0.7% | 517.70 |
| EBITDA | 64.99 | -3.7% | 67.51 |
| PAT | 169.27 | +155% | 66.54 |
| EPS (Reported) | 9.64 | +156% | 3.76 |
The Jump Explained. Net profit soared 155%, yet revenue barely budged. The spread came from other income: ₹150.43 crore in FY26 versus ₹41.49 crore a year prior — a ₹109 crore swing. Dividend income (₹92.56 crore in FY26) and fair-value gains on financial assets booked through P&L explain most of this. Operating profit (EBITDA) contracted 3.7%, revealing that operations actually slowed while accounting gains accelerated profit. The company also cut tax expense sharply: effective tax rate fell to 12.3% in FY26 from 19.5% in FY25, a windfall that inflated reported EPS. Announced dividend of ₹0.50 per share implies a nominal payout, far below earnings.
5. Market Expectations & Historical Multiples
This section describes how the market is currently pricing the company and how that compares with its own history and peer group. It is descriptive, not predictive.
| Metric | Current | Historical Avg (5yr) | Peer Median |
|---|---|---|---|
| P/E | 11.6 | 43.7 | 20.2 |
| EV/EBITDA | 9.53 | — | — |
| ROCE | 13.3% | 4.2% | 14.0% |
| ROE | 12.8% | 6.96% | 12.4% |
The market pays 11.6x earnings here versus a peer median of 20.2x — a 42% discount. The company’s own 5-year P/E average stands at 43.7x, inflated by years of razor-thin or negative earnings. ROCE expanded sharply to 13.3% in FY26 (from 4% in FY25), driven by the one-time profit surge, and now sits in line with the peer median of 14%. ROE, too, climbed to 12.8% from a 3-year average of 7%, reversing a 15-year trend of chronically weak capital returns.
The market appears to be pricing in structural stagnation — flat revenue, thin competitive moat, concentration risk — offset by the asset base: ₹860 crore of investments on the balance sheet provide a ballast. At 11.6x, the multiple sits well below both history and peers, yet below-market returns persist. Does a fortress balance sheet cure weak operations, or just delay reckoning?
6. What’s Cooking
One-off labour code charge (₹141 lakh). The Government consolidated 29 labour laws into 4 labour codes, effective November 2025. The company recognized past service liabilities on actuarial valuation. Non-recurring, but marks a compliance headwind.
ED investigation of subsidiary (December 2025). The Directorate of Enforcement searched company offices and executive residences on Dec 19, 2025, investigating a subsidiary (Urban Infrastructure Venture Capital Limited) for alleged money laundering. ED froze ~₹99 crore of the subsidiary’s investments. The company is cooperating; impact on consolidated numbers remains unknown.
CBI ordered by High Court (February 2025). A High Court bench ordered CBI investigation into the company itself. Case details remain under wraps; no financial impact quantified yet.
Intercorporate deposit overdue (₹2,147 lakh). A subsidiary advanced money as intercorporate deposits years ago. The borrowers are in default; interest accrued but unpaid. The subsidiary initiated legal proceedings. Management views recovery as good, citing borrower asset value and promoter commitment. Auditor flagged as qualified opinion risk.
Capital reduction by associate (April 2025). Urban Infrastructure Holdings Private Limited, an associate, returned ₹362.72 crore to Jai Corp via capital reduction. This is a capital withdrawal, not earnings.
Board composition fines (November 2025). BSE and NSE levied ₹16,520 each for non-compliance with board composition and NRC norms. Fines paid September 2, 2025.
One subsidiary struck off (January 2026). Jai Corp Welfare Limited, a non-material wholly-owned entity, was struck off from the Register of Companies on Jan 27, 2026.
7. Balance Sheet
| Item | FY26 | FY25 | FY24 |
|---|---|---|---|
| Total Assets | 1,558.87 | 1,449.35 | 1,535.42 |
| Net Worth | 1,490.52 | 1,169.97 | 1,246.53 |
| Borrowings | 0.50 | 235.72 | 235.72 |
| Total Liabilities | 68.35 | 279.38 | 288.89 |
Assets = Liabilities check: FY26 assets ₹1,558.87 cr; equity ₹1,490.52 cr + liabilities ₹68.35 cr = ₹1,558.87 cr. ✓
Three observations:
Debt vaporized. Borrowings crashed from ₹235.72 crore in FY25 to ₹0.50 crore in FY26 — a deleveraging sprint. The company went nearly debt-free in a single year. This shields cash from interest drag but doesn’t fix the fact that a business throwing 13% ROCE needs leverage like it needs a hole in the wall.
Investments dominate assets. At ₹860.30 crore, financial investments represent 55% of total assets. Cash-like holdings are the ballast, not operations. A portfolio company wearing a plastic-processing mask.
Working capital jumped 19%. Days-payable cycles expanded; inventory and receivable management loosened. The company is tying up more cash in working capital despite flat revenue — a sign of either production ramping (not visible in volumes) or collection/inventory slippage (more likely).
8. Cash Flow: Sab Number Game Hai
| Year | Operating | Investing | Financing |
|---|---|---|---|
| FY26 | 13.56 | 85.22 | -96.67 |
| FY25 | 44.99 | 111.03 | -155.15 |
| FY24 | 40.98 | -29.99 | -11.18 |
Operating cash dwindled to ₹13.56 crore in FY26 from ₹44.99 crore in FY25 — a 70% cliff. Profit rose 155%, but cash from operations fell 70%. That divergence screams non-cash gains and working-capital drains. Investing cash was ₹85.22 crore inflow, driven by selling down financial investments (₹164 cr sale vs ₹166 cr purchase). Financing was -₹96.67 crore, mostly dividend paid-out (₹96.53 crore). The company distributed nearly all free cash to shareholders, funded by liquidating the investment portfolio. That playbook works only as long as assets don’t run dry.
9. Ratios: Sexy or Stressy?
| Ratio | FY26 Value | Reading |
|---|---|---|
| ROE | 12.8% | Equity is now working at reasonable pace after years of 3–7% torpor. FY26 is a spike; sustainability unclear given flat revenue and one-time profit drivers. |
| ROCE | 13.3% | Capital employed is earning at par with peer median (14%), a turnaround from the 4% wasteland of FY22–24. Operating leverage helped, but scale stalled. |
| P/E | 11.6 | Reported at ₹112.76 price and ₹9.64 EPS. Sits 42% below peer band and 73% below the company’s own 5-yr avg — discount reflects execution risk, not value. |
| PAT Margin | 32.9% | Net margin ballooned to nearly 33% because other income is 29% of total income. Remove one-time gains, and operating margin is 10.6% — a respectable, unremarkable level for the sector. |
| D/E | 0.00 | Debt-to-equity erased. The company has ₹0 net debt and ₹860+ crore of investments; net worth is a castle. Fortress balance sheet shackled to a ₹514 crore revenue body. |
10. P&L Breakdown: Show Me the Money
| Year | Revenue | EBITDA | PAT |
|---|---|---|---|
| FY26 | 514.34 | 64.99 | 169.27 |
| FY25 | 517.70 | 67.51 | 66.54 |
| FY24 | 463.06 | 48.98 | 52.51 |
Revenue has oscillated in a ₹460–520 crore band for three years — no growth, no decline, just flatness. EBITDA tracks operationally in line, around 10.6–13% margin. But net profit swung wild: ₹52 crore (FY24) → ₹66 crore (FY25) → ₹169 crore (FY26). That volatility is other income, not the core franchise. Extract the one-off: operating profit is ₹64.99 crore, down from ₹67.51 crore a year earlier. The business is silently contracting while the balance sheet asset base inflates the headline.
11. Peer Comparison
| Company | Revenue (FY26 ₹cr) | PAT (FY26 ₹cr) | P/E |
|---|---|---|---|
| Supreme Industries | 11,217.68 | 932.76 | 47.5 |
| Astral | 6,568.60 | 551.24 | 73.5 |
| Garware Hi Tech | 2,120.11 | 338.23 | 42.1 |
| Time Technoplast | 6,105.20 | 468.72 | 17.9 |
| Finolex Industries | 4,113.43 | 599.05 | 17.9 |
| Jai Corp | 514.34 | 169.27 | 11.6 |
| Peer Median (38 cos) | 320.07 | 11.40 | 20.2 |
Jai Corp is the smallest player in the frame by far — 1.6x the peer median revenue but delivering 14.8x the peer median PAT. The gap isn’t operational muscle; it’s the investment portfolio and other income. On a like-for-like operating basis, the company generates ₹64.99 crore EBITDA on ₹514.34 crore revenue (12.6% margin), comparable to industry norms. Yet it trades at 11.6x P/E, versus peers at 20.2x median — a discount justified by scale disadvantage and customer concentration, not valuation arbitrage.
12. Miscellaneous: Shareholding & Promoters
| Holder | % Stake |
|---|---|
| Promoters (Jain family & trusts) | 73.91% |
| FIIs | 0.80% |
| DIIs | 1.57% |
| Public | 23.71% |
The Jain family — Harsh, Ruchi, Ankit, Gaurav, and Sushma — together control ~73% through direct holding and five family trusts (NK, Mega, Ljnk, Escrow buyback, etc.). No promoter pledge. Public float at 24% is adequate; institutional interest (FII + DII) sits at 2.4%, muted.
The promoter story is tidy but silent. Three decades in, the group has built a fortress balance sheet ($860 cr investments, zero debt) yet failed to scale operations meaningfully. Real estate bets (Rewas Ports, SEZs) have stalled or languished. The plastic division is captive to one customer. Steel is dead. Spinning is wound down. The financial asset base suggests the family prioritized capital preservation over business expansion — a bet that cash beats operations.
13. Corporate Governance: Angels or Devils?
Auditor Opinion. The statutory auditor (Chaturvedi & Shah LLP) issued a qualified opinion on consolidated results. Two qualifications: (i) missing financial data from Urban Infrastructure Holdings Private Limited, an associate, for FY26 — impact unquantified; (ii) ₹2,147 lakh intercorporate deposit overdue since prior years, interest accrued and disputed, legal proceedings initiated, no impairment provision taken. The auditor flagged uncertainty over recovery and possible impacts on the subsidiary and consolidated numbers.
Related-party transactions. None disclosed as material.
Board Composition. The company was fined ₹16,520 each by BSE and NSE in September 2025 for non-compliance with board composition (independent director norms) and NRC requirements. Fines were paid but flagged a governance lapse.
ED Investigation (December 2025). The Directorate of Enforcement conducted searches at the company’s Mumbai office and residences of the Chairman, Vice-Chairman, and MD on December 19, 2025, investigating a subsidiary (Urban Infrastructure Venture Capital Limited) for alleged money laundering. ~₹99 crore of the subsidiary’s assets (shares, mutual funds) were frozen pending investigation. No charges filed yet; company stated it is cooperating.
CBI Investigation ordered (February 2025). A Delhi High Court bench ordered CBI to investigate the company following a petition. Details remain sealed; no charge sheet filed.
Regulatory Risks. The company faces material regulatory and reputational headwinds: ED action on a subsidiary, CBI probe into the parent, qualified audit opinion, and board fines. None of these have produced financial charges yet, but they signal governance stress and execution uncertainty.
14. Industry Roast & Macro Context
The plastics-conversion sector (woven sacks, jumbo bags, geotextiles) is fragmented, price-competitive, and hamstrung by raw-material pass-through. Players scale via brand, geography, or customer capture. Jai Corp has none: it’s a single-customer, India-centric job-shop. The global plastic shortage of 2021–22 sparked demand spikes; those tails have unwound. Commodity PP prices have normalized, flattening margins.
Galvanized steel is a commodity input market, dominated by bulk producers and traders. Jai Corp exited the game.
Real estate near Mumbai has been red-hot, but SEZs face regulatory flux post-Trade Facilitation Agreement reviews, and ports stall on infrastructure bottlenecks. The company’s bets (Rewas Ports, industrial estates) have been mulling for years with no material monetization.
Regulatory risks are rising: labour code compliance, ED scrutiny, CBI oversight. The sector in aggregate enjoys modest tailwinds (infrastructure spend, packaging demand), but Jai Corp’s fragment is stagnant and inward-looking.
15. EduInvesting Verdict
| Strengths | Weaknesses |
|---|---|
| Zero debt; ₹860 cr investment portfolio; ₹12 cr cash. | Revenue flat for 3 years at ₹514 cr; no volume growth. |
| ROE and ROCE rebounded to 12.8% and 13.3% respectively. | Single customer = 86% of revenue; concentration risk is existential. |
| Audited accounts; transparent filings. | ED froze subsidiary assets; CBI investigation ongoing; audit qualification on collectible. |
| Real estate ventures stalled; Spinning wound down; Steel dead. |
| Opportunities | Threats |
|---|---|
| Asset base could fund small inorganic plays if capital deployed strategically. | One customer exits or reduces volume; plastic division evaporates. |
| Dividend reinstatement if capex discipline holds. | ED/CBI findings impose penalties or operational restrictions. |
| ₹2,147 cr ICD default materializes as impairment or loss. |
A company with a fortress balance sheet and a fading engine. The cash position and investment portfolio are genuine; the operating franchise — dependent on a single customer, stalled in real estate, and losing scale in steel — is not. Profit surged in FY26 on one-time accounting gains and dividend income from a portfolio that earns modest single-digit returns. When assets run down or markets compress valuations, the gap between balance-sheet wealth and operating reality will tighten. The board’s silence on growth strategy, alongside regulatory headwinds and concentrated revenue, leaves the central tension unresolved: does a ₹860 crore treasure trove fix a ₹514 crore stalled business, or merely postpone the reckoning?
Prices referenced are lagged to May 30, 2026 (₹112.76 NSE closing). Figures are consolidated, audited, for the fiscal year ended March 31, 2026. All data sourced from audited financial results filed with BSE/NSE.
