1. At a Glance
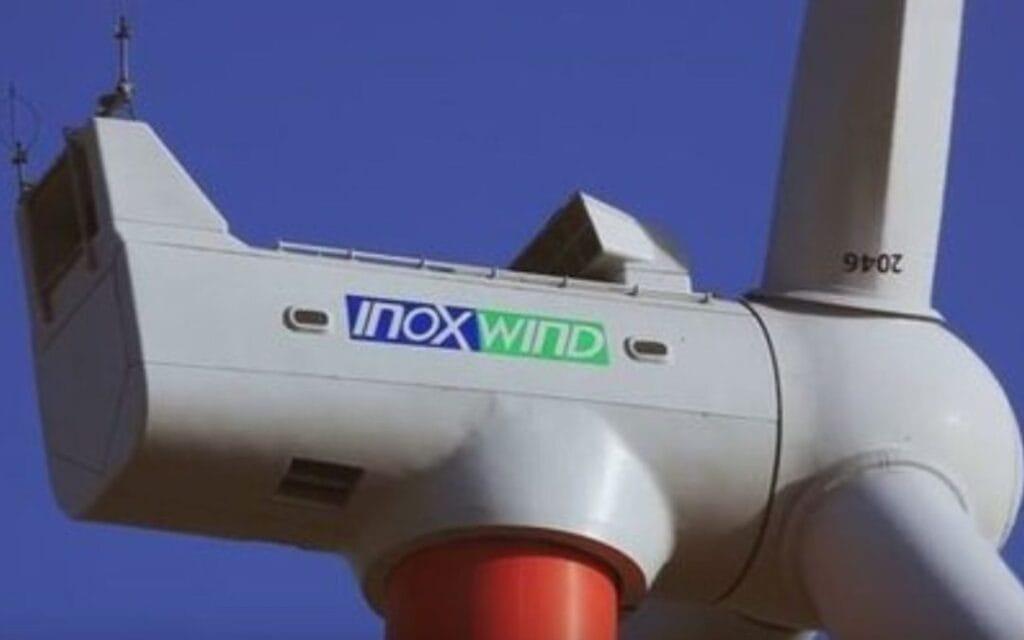
Inox Wind Ltd, the Inox Group’s ambitious wind energy arm, is back in the green after years of losses — and it’s blowing harder than ever (financially, not meteorologically). With 3.1 GW of unexecuted orders, a shiny new 4.X MW turbine platform on the horizon, and a market cap of ₹23,684 Cr, the company has gone from “Suzlon’s less-famous cousin” to one of the hottest turnaround plays in the renewable space. Of course, with 180 working capital days, it’s still the corporate equivalent of “money leaves faster than it comes in,” but at least the blades are spinning in the right direction.
2. Introduction
Remember when Inox Wind was the poster child for hownotto run a capital-heavy business? Years of losses, ballooning debt, delayed projects… and then, like a wind gust in Rajasthan, things changed.
The recipe for revival:
- Cut debt like it’s a corporate fad diet.
- Secure India’slargest-ever wind OEM contract(1,500 MW from CESC in Feb ’24).
- Lock in repeat orders from major players like Hero Future Energies (210 MW in Apr ’24).
- Merge the holding company (Inox Wind Energy Ltd) with the operating company for cleaner structure.
Today, the company is integrated end-to-end — from manufacturing nacelles and blades to EPC and post-installation O&M — making it one of the few “one-stop wind shops” in India. The 4.X MW turbine platform, once commercially launched, could make it globally competitive in capacity and efficiency.
3. Business Model (WTF Do They Even Do?)
A) Manufacturing (IWL)
- WTGs: 2 MW, 3 MW, and upcoming 4.X MW platforms.
- Components: Nacelles, hubs, rotor blades, tubular towers.
- Capacity: 1,900 MW nacelle/hubs, 1,600 MW blades, 600 MW towers.
B) EPC (IWL)
- Wind resource assessment.
- Site acquisition & infra development.
- Grid connectivity & commissioning.
C) O&M (IGESL)
- 10 GW under service across 8 states.
- Targeting +1 GW/year capacity addition through FY24–FY26 (organic & inorganic).
Key Advantage: Unlike many OEMs, Inox keeps the O&M contracts, ensuring recurring revenue and client lock-in.
4. Financials Overview
| Metric | Q1 FY26 | Q1 FY25 | Q4 FY25 | YoY % | QoQ % |
|---|---|---|---|---|---|
| Revenue (₹ Cr) | 826 | 640 | 1,275 | 29.1% | -35.2% |
| EBITDA (₹ Cr) | 184 | 135 | 254 | 36.3% | -27.6% |
| PAT (₹ Cr) | 97 | 42 | 190 | 131.0% | -48.9% |
| EPS (₹) | 0.61 | 0.07 | 1.35 | 771% | -54.8% |
Commentary:
- YoY revenue growth is solid at 29%, with PAT more than doubling — proof the turnaround is real.
- QoQ drop is seasonal — wind project execution is lumpy.
- Margins holding at ~22% OPM, which is healthy for a capital goods player.
- Annualised EPS ~₹2.44 → P/E ~56x (renewable optimism premium).
5. Valuation (Fair Value RANGE only)
Method 1: P/E
- Sector median for profitable renewables ≈ 40–45x.
- On FY26E EPS ~₹3.0, FV range = ₹120 – ₹135.
Method 2: EV/EBITDA
- TTM EBITDA = ₹815 Cr; Sector EV/EBITDA = 10–12x.
- EV range ₹8,150 – ₹9,780 Cr → Equity FV per share: ₹115 – ₹140.
Method 3: DCF
- Assuming 15% FCF CAGR for 5 years, WACC 12%, terminal growth 4% → ₹118 – ₹142.
Fair Value RANGE:₹115 – ₹142Disclaimer:This FV range is for educational purposes only and is not investment advice.
6. What’s Cooking – News, Triggers, Drama
- Record Order Book: 2,656 MW pending, with CESC’s 1,500 MW contract as a crown jewel.
- 4.X MW Turbine Launch: License secured; commercial rollout will be a major tech leap.


