Inox Green Energy Services Ltd: 3.5 GW of O&M & a P/E Higher Than Mount Everest’s Base Camp
1. At a Glance
India’s only pure-play listed renewable O&M provider — and by “pure-play” we mean they do one thing and pray they get paid on time. They babysit wind turbines across 8 states, clocking in ~3.5 GW of capacity under their watch. The company dreams of hitting 10 GW in 3–4 years, which is basically like saying, “We’ll triple our work, but don’t ask about the ROE.” Oh, and their P/E is 148 — which means you’re paying for their dreams, not their dividends.
2. Introduction
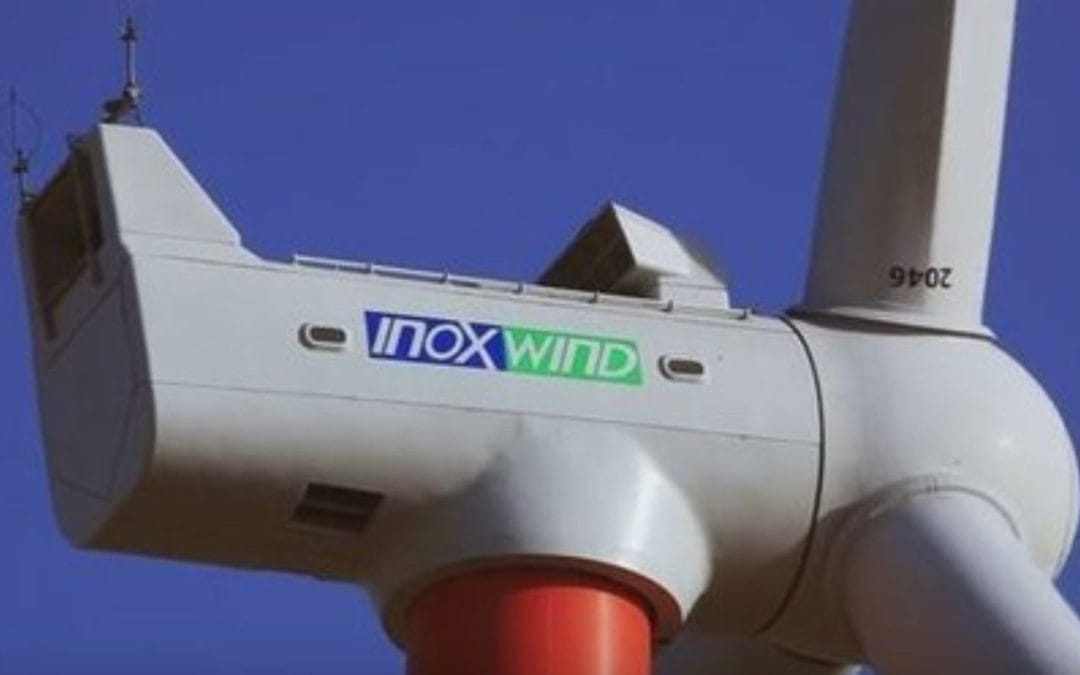
Imagine you’re the apartment maintenance guy — you don’t own the building, you don’t decide who lives there, but if the lift breaks, you’re the hero everyone calls at 2 AM. That’s Inox Green Energy Services Ltd in India’s renewable energy sector. Born in 2012 as the O&M arm of Inox Wind Ltd, this is the side of the Inox GFL group that keeps wind turbines spinning and customers from suing.
Now, O&M in wind power isn’t glamorous — it’s like being the mechanic in a Formula 1 pit stop, but your race lasts 20 years, and instead of champagne showers, you get accounts receivable days of 279.
Inox Green thrives on long-term contracts (5–20 years), steady cash flow (assuming people actually pay), and a spread-out portfolio that makes them as geographically diversified as India’s monsoon patterns. They’ve got Gujarat leading the charge with 1,551 MW, Rajasthan trailing with 572 MW, and token presence in Kerala (16 MW, aka one medium-sized wind farm).
Their pitch: “We keep turbines turning.” The subtext: “We’ll also diversify into solar O&M and hybrid projects… once the paperwork with NCLT stops giving us headaches.”
3. Business Model (WTF Do They Even Do?)
Inox Green’s entire gig is wind turbine babysitting. But instead of babysitting one toddler, you’ve got 1,396 giant, moody toddlers that need constant attention.
Three revenue spinners:
Operation Services – 24/7 monitoring, site staff, client relationship teams. Basically, an army of people ensuring your turbine doesn’t have a bad hair day.
Maintenance Services – Predictive (spot problems before they happen) and reactive (fix it after it breaks). Think: insurance vs. hospital visits.
Value-Added Services – Performance improvements and hybrid energy solutions. The “upsell” menu.
Moat: Long-term O&M contracts with predictable revenue. But remember, predictable in power sector O&M means “as long as government policies don’t randomly change, your client doesn’t default, and there’s no cyclone flattening your asset.”
They make ~₹80 Cr revenue & ₹40 Cr EBITDA per GW, which means at 3.5 GW they’re already pulling in healthy topline. The dream? 10 GW = ₹800 Cr revenue territory. The execution risk? Huge.
4. Financials Overview
Metric
Q1 FY25
Q1 FY24
Q4 FY25
YoY %
QoQ %
Revenue (₹ Cr)
56.2
50.9
68.0
10.5%
-17.4%
EBITDA (₹ Cr)
16.3
13.9
1.0
17.3%
1530%
PAT (₹ Cr)
22.0
0.85
6.0
2487%
266.7%
EPS (₹)
0.60
0.02
0.15
2900%
300%
EPS Ann. (₹)
2.40
—
—
—
—
Commentary: PAT shot up 25x YoY, thanks to a massive “Other Income” line item that’s juicier than the actual business. EBITDA recovery QoQ looks dramatic, but remember — Q4 was basically a one-month tea break.
5. Valuation (Fair Value RANGE only)
P/E Method: EPS Ann. = ₹2.40 Industry P/E = ~39 FV = ₹93.6
EV/EBITDA Method: EV = ₹5,781 Cr EBITDA Ann. = ₹65.2 Cr (Q1 × 4) EV/EBITDA Industry Avg = ~25