1. At a Glance
Once upon a time, Indo Cotspin thought making carpets and non-woven fabrics would roll in riches. Instead, they’re rolling out P&Ls flatter than their designer shaggy rugs. Incorporated in 1955, they sell carpets, felt, door mats, and geo-textiles, but FY25 sales are barely ₹23.8 Cr. Net profit? ₹0.3 Cr. Basically, one posh wedding carpet in Delhi probably costs more than their quarterly PAT.
2. Introduction
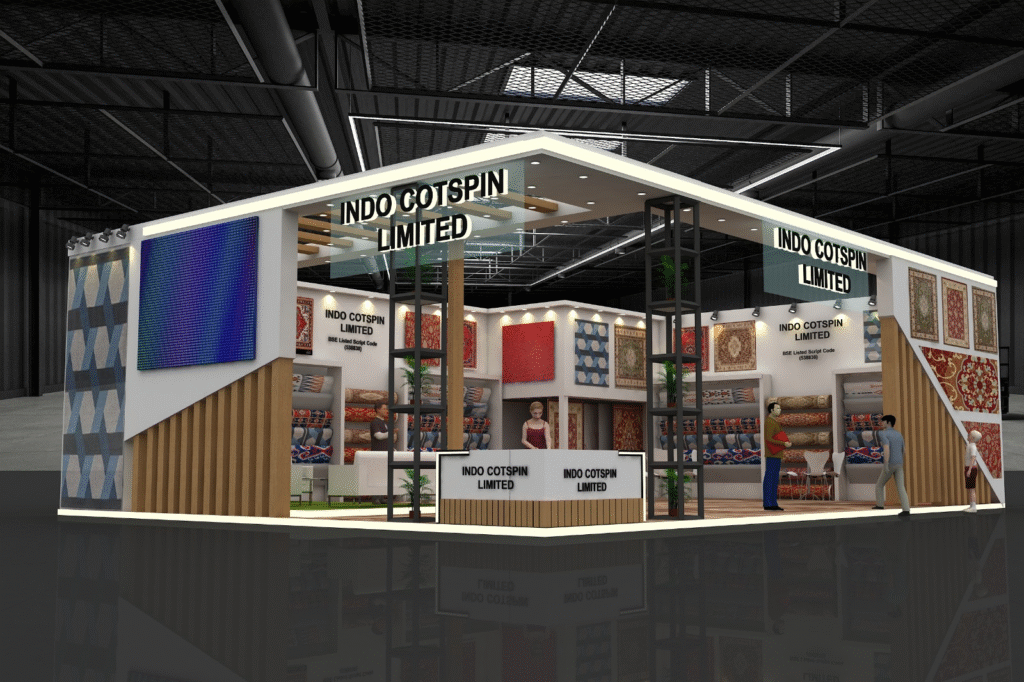
Carpets are supposed to add luxury. Indo Cotspin’s financials add tension. The company proudly says “Non-Woven & Tufted Carpets, Designer Felt Carpets, Shaggy Woolens.” Fancy words. But look closer: Q4 FY25 sales fell 38% YoY, profit collapsed to zero.
This is a company that once wanted tovoluntarily delist in 2021to get promoter control. Translation:“Public shareholders, please leave, you’re embarrassing us.”Yet somehow, the stock is still floating on BSE with a market cap of ~₹22 Cr.
And despite 70 years in business, Indo Cotspin remains a ₹20 Cr turnover company. That’s not a textile empire, that’s a power loom gali ka account book.
3. Business Model (WTF Do They Even Do?)
Let’s decode:
- Non-Woven Carpets: Plain, printed, felt, designer. Basically, mall flooring.
- Hand-Tufted Carpets: Shaggy, woolen — the kind in hotel lobbies where you spill chai and pray nobody notices.
- Door Mats: The actual product that symbolises their financials: “Welcome… please wipe feet.”
- Geo-Textiles: Non-woven geo fabrics used in infrastructure, agriculture, and civil works. Potential, but niche.
- Imports: 6.7% raw materials like latex chemicals and textile stock lots.
Revenue? 99% domestic sales. Global exports dream? Still rolled up in the warehouse.
4. Financials Overview
| Metric | Latest Qtr (Q1 FY26) | YoY Qtr (Q1 FY25) | Prev Qtr (Q4 FY25) | YoY % | QoQ % |
|---|---|---|---|---|---|
| Revenue | ₹1.91 Cr | ₹3.07 Cr | ₹6.35 Cr | -38% | -70% |
| EBITDA | ₹0.12 Cr | ₹0.15 Cr | ₹0.17 Cr | -20% | -29% |
| PAT | ₹0.00 Cr | ₹0.10 Cr | -₹0.01 Cr | -100% | Turnaround |
| EPS | 0.00 | 0.14 | -0.01 | NA | Turnaround |
Annualised EPS ~₹0.42. CMP ₹31 → P/E ~74×.Industry P/E ~22×. Market clearly smokes stronger stuff than Indo Cotspin’s board.
5. Valuation (Fair Value RANGE only)
- P/E Method: EPS ~₹0.42. At 15× = FV ~₹6.
- EV/EBITDA: EV ₹21 Cr, EBITDA ~₹1 Cr → EV/EBITDA = 21×. Too high.
- DCF: Sales growth 20% over 5 years, but low base. Reasonable FV = ₹8–12.
Fair Value Range: ₹6–12(Educational purpose only, not investment advice.)
6. What’s Cooking – News, Triggers, Drama
- Delisting Drama (2021): Promoters wanted to take it private. Didn’t happen. Still stuck on BSE SME.
- Director Exit (2021): Whole-time director Sahil Aggarwal resigned. Cue stability issues.
- Recent Performance: Sales peaked at ₹25 Cr in FY24, fell back to ₹23.8 Cr in FY25. Flatlining.
- Macro: India’s geo-textile demand rising, but Indo Cotspin hasn’t cashed in yet.
7. Balance Sheet
| Metric | FY25 |
|---|---|
| Equity Capital | ₹7.14 Cr |
| Reserves | ₹0.11 Cr |
| Debt | ₹0.02 Cr |
| Net Worth | ₹7.25 Cr |
| Total Liabilities | ₹7.74 Cr |
| Fixed Assets | ₹2.6 Cr |
