1.At a Glance
GE Power India just reportedQ1 FY26 income up 34.4% YoYand a swing to ₹316 Cr profit before tax. ROE is showing a ridiculous105%— not because the business suddenly became an earnings machine, but because last year’s balance sheet was thinner than an air fryer manual and this quarter’s profit was fattened by a side of “Other Income Curry”. Sales growth over 5 years? A chilly-15.6% CAGR. But in true EPC style, order backlog is up13.1%, keeping hope alive for the next tender season.
2.Introduction
If Indian infrastructure stories were Bollywood, GE Power India would be that veteran actor who was once a superstar in the 90s, then vanished, and now pops up in cameos that get unexpected applause. The company still builds big, noisy things — boilers, turbines, flue gas desulphurisation units — but the party is quieter than it used to be. The latest quarter looks like a box office hit, but the trailer hides some “special effects” in the form of chunky other income.
3.Business Model (WTF Do They Even Do?)
GE Power India is in theEPC (Engineering, Procurement & Construction)game for thermal and hydro power plants. The four big business buckets:
- Core Equipment: Boilers, turbines, generators for heavyweights like BHEL, NTPC.
- Service & Upgrades: Refitting and overhauling existing plants — because old turbines need love too.
- FGD (Flue-Gas Desulphurisation): Equipment to make coal plants slightly less planet-killing.
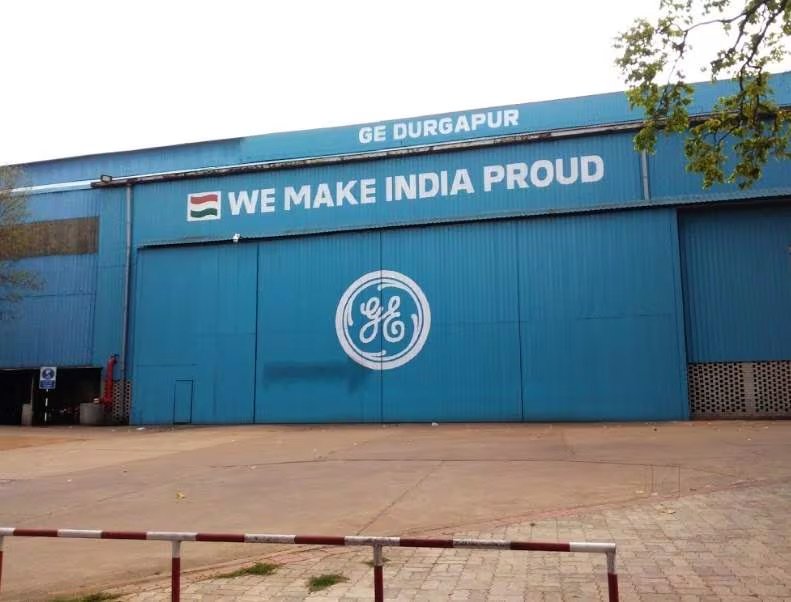
- Durgapur Parts Factory: Boiler pressure parts
- & cryogenic vessels, exported across APAC, MENAT, and SSA.
4.Financials Overview
| Metric | Latest Qtr (Q1 FY26) | YoY Qtr (Q1 FY25) | Prev Qtr (Q4 FY25) | YoY % | QoQ % |
|---|---|---|---|---|---|
| Revenue (₹ Cr) | 287 | 213.6 | 266 | 34.4% | 7.9% |
| EBITDA (₹ Cr) | -12 | -18 | -35 | NA | 65.7% |
| PAT (₹ Cr) | 35 | -10 | 164 | NA | -78.7% |
| EPS (₹) | 5.16 | -1.42 | 24.43 | NA | -78.9% |
Annualised EPS = ₹5.16 × 4 = ₹20.64 → P/E ≈ 16.5× at CMP ₹340.
5.Valuation (Fair Value RANGE only)
Method 1: P/E Approach
- Industry peer range: 20–30×.
- FV = ₹413 – ₹619 (assuming current earnings are sustainable, which is… optimistic).
Method 2: EV/EBITDA
- TTM EBITDA = ₹-64 Cr (negative) → Not meaningful.
Method 3: DCF
- Assuming 6% sales CAGR, 9% WACC, and margin recovery to 6% → FV ≈ ₹250 – ₹350.
Educational FV Range:₹250 – ₹350(For educational purposes only — this is an EPC business, not a magic bean factory.)
6.What’s Cooking – News, Triggers, Drama
- Order Bookup 13.1%


