1. At a Glance
Dish TV is the tragic Netflix-wannabe of Indian broadcasting — once the king of satellite dishes on rooftops, now reduced to a penny stock trading at ₹5, with a book value so negative it belongs in Dante’s Inferno. Quarterly revenues collapsing 28%, profits vanishing like cable operators after TRAI rules, and promoter holding at 4% — yes, even the founders don’t want to watch this show.
2. Introduction
Picture 2008: neighbors fighting over who gets the Dish TV remote, TV booming with “Sa Re Ga Ma Pa” reruns, and Dish ruling the DTH universe. Fast forward to 2025: streaming apps ate the pie, and Dish TV is left licking crumbs.
The irony? Dish tried to “reinvent” itself with OTT bundles, Android-powered boxes, and something called Watcho (an OTT super-app nobody remembers downloading). But while Netflix charges extra for ads, Dish TV pays extra to survive.
The market has punished the company brutally — share price collapsed 66% in a year, market cap under ₹1,000 Cr, and investors running away faster than viewers skipping ads. The real punchline? Despite 30% operating margins, Dish reports losses because “other income” is a black hole and debt obligations refuse to die quietly.
3. Business Model (WTF Do They Even Do?)
Dish TV’s business is like Doordarshan trying to trend on Instagram: outdated but refusing to retire.
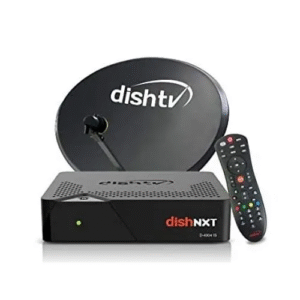
- DTH services: DishTV, d2h, Zing — the holy trinity of remote controls your parents still use.
- Hybrid set-top boxes: Dish SMRT Hub & DTH Stream — Android-based boxes that try to make dumb TVs smart. Except, viewers already bought Smart TVs. Oops.
- OTT bundling: Watcho app + Disney+ Hotstar, Zee5, Sony LIV etc. in one plan. Basically, a “buy one, get others free” package.
- Zing Super Box: Free 200+ channels for 2 years. Translation: “Please, for god’s sake, watch us.”
- Revenue mix FY24: Subscription (23%), infra support (53%), ads (2%),
- teleport + others (tiny). So the core business isn’t TV, it’s renting out satellite infra.
In short: they’re trying to be Netflix + JioFiber + YouTube + DD FreeDish, all at once — result? A confused brand with losses.
4. Financials Overview
Quarterly Snapshot (₹ Cr.)
| Metric | Jun 2025 | Jun 2024 | Mar 2025 | YoY % | QoQ % |
|---|---|---|---|---|---|
| Revenue | 329 | 455 | 344 | -27.7% | -4.4% |
| EBITDA | 73 | 164 | 97 | -55.5% | -24.7% |
| PAT | -94.5 | -2 | -402 | -5,860% | +76.5% |
| EPS (₹) | -0.51 | -0.01 | -2.18 | NA | NA |
Annualised EPS = negative →P/E = “Not Meaningful”(unless you enjoy calculating infinity).
Commentary: Revenue falling like TRP of Indian Idol, losses widening, and margins evaporating.
5. Valuation (Fair Value RANGE only)
Method 1: P/S approach
- Sales FY25 = ₹1,442 Cr
- Industry P/S avg = 1.0×
- FV = ₹1,442 Cr EV → per share =₹7.5–8.0
Method 2: EV/EBITDA
- EBITDA FY25 = ₹437 Cr
- EV = ₹788 Cr
- EV/EBITDA = 1.8× (super cheap vs 10× industry)
- FV range = 5–8× EBITDA →₹12–18 per share
Method 3: DCF (reality check)
- FCF negative multiple years, so DCF = “Dead Cash Flow.”
👉Consolidated FV Range: ₹7 – ₹15
⚠️ Disclaimer:This FV range is for educational purposes only


