1. At a Glance
At ₹248 a share (as of Oct 10, 2025), Affordable Robotic & Automation Ltd (ARAPL) trades like that underdog startup your engineer friend keeps bragging about — full of potential, no cash, and a CEO with a PowerPoint addiction.
With a market cap of ₹279 crore, revenue of ₹166 crore (FY25), and P/E that defies logic at 184×, this is India’s first listed robotics automation company — though from its balance sheet, you’d think it’s a social experiment in patience.
Q2 FY26 results showed a flicker of life — Revenue ₹25.75 crore, EBITDA ₹5.96 crore, and PAT ₹4.18 crore (up 137% QoQ). Management proudly called it a “turnaround.” Investors called it “barely breathing.”
Still, this Pune-based firm is scripting a Bollywood-style redemption arc — from welding robots for Maruti Suzuki to building automated parking towers for Lodha and Parinee.
And if you think it’s all “robotics,” hold your algorithm — 35% of revenue still comes from car parking. Because even robots in India get stuck looking for parking.
2. Introduction — The Curious Case of the Missing Margins
Let’s set the scene.
In 2009, a team of engineers with dreams bigger than their welding arms started ARAPL — India’s pioneer in industrial and warehouse automation.
Fast-forward to today:
- 5,000+ robots deployed,
- 10,000 automated car parks installed,
- 8 patents,
- Subsidiary in the US (ARAPL RaaS),
- Proprietary software stack with names that sound like Greek gods — Maia, Zeus, Atlas, and Hercules.
Yet the financial gods haven’t blessed them equally.
Despite having robots named Hercules, the balance sheet often looks like it’s lifting pebbles.
Margins swing like election moods — from -72% to +28% within quarters. Return on equity is -10.9%, and debt at ₹65 crore is starting to look clingier than a rejected chatbot.
Still, there’s hope. Q2 FY26 shows green shoots, or at least, green LEDs blinking. The company recently bagged a ₹3.6 crore US lease order and is eyeing a USD 8–10 million fundraise.
Is this India’s next automation hero or just another “Make in India” poster child waiting for a subsidy cheque? Let’s dig deeper.
3. Business Model — WTF Do They Even Do?
Affordable Robotic is India’s jack of all automation trades — half Elon Musk, half civil contractor.
Here’s the portfolio decoded:
🔩 1. Industrial Automation (64% of FY23 revenue)
They make robots and automation lines for automotive OEMs like Mahindra, Maruti Suzuki, Honda, TVS, Volvo, and Piaggio.
Products range from robotic welding cells, gantries, conveyors, pick & place systems, MIG/TIG stations, and inspection systems — basically, if it moves or welds, they automate it.
🏗️ 2. Robotic Car Parking (35%)
Puzzle parking, rotary towers, chess-style stacking — they’ve gamified parking for developers like Lodha, Parinee, and VTP Realty. Ironically, their profits have less space than the cars they park.
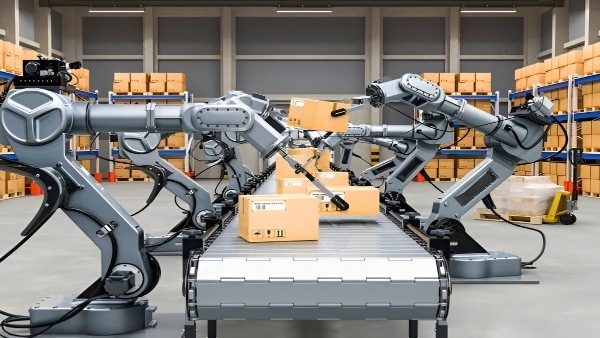
📦 3. Warehouse Automation (via ARAPL RaaS)
This is their modern play — automated guided vehicles (AGVs), AMRs, and AI-driven warehouse management systems. Their four key products — Maia, Zeus, Atlas, and Hercules — sound powerful enough to conquer Olympus, but mostly move boxes in a Pune warehouse.
🧠 4.