Afcom Holdings FY26: ₹583 Cr Revenue, 144% Annualised Growth, ₹401 Cr New Debt for Fleet
General information and entertainment, not investment advice. The author is not a SEBI-registered adviser or research analyst. No recommendation, no promised returns. Markets carry risk including loss of capital. Figures may not be current. Consult a registered adviser before acting.
Prices referenced are lagged; as of 10 June 2026, CMP ₹870 per share.
1 — At a Glance
Afcom closed FY26 with ₹583 Cr in sales—a 144% jump from FY25’s ₹239 Cr. Not a typo; a full fleet-capacity ramp.
Net profit landed at ₹122 Cr (36% PAT margin), up 152% from ₹48 Cr a year ago. The treble-digit growth is raw: more aircraft = more cargo = more margin. But one number casts a shadow. Borrowings vaulted from ₹26 Cr to ₹401 Cr. The balance sheet traded lightness for leverage to fund five freighter aircraft.
The question isn’t whether growth is real—it’s whether leverage takes it hostage.
2 — Introduction
Afcom Holdings, incorporated 2013, is India’s standalone cargo airline. It operates Boeing 737-800 freighters on airport-to-airport cargo runs: e-commerce, seafood, pharmaceuticals, mobile phones, hazmat. No passengers; all cargo. The company got its Air Operator Permit in Aug 2024 and went public the same month at ₹450/share, IPO size ₹74 Cr.
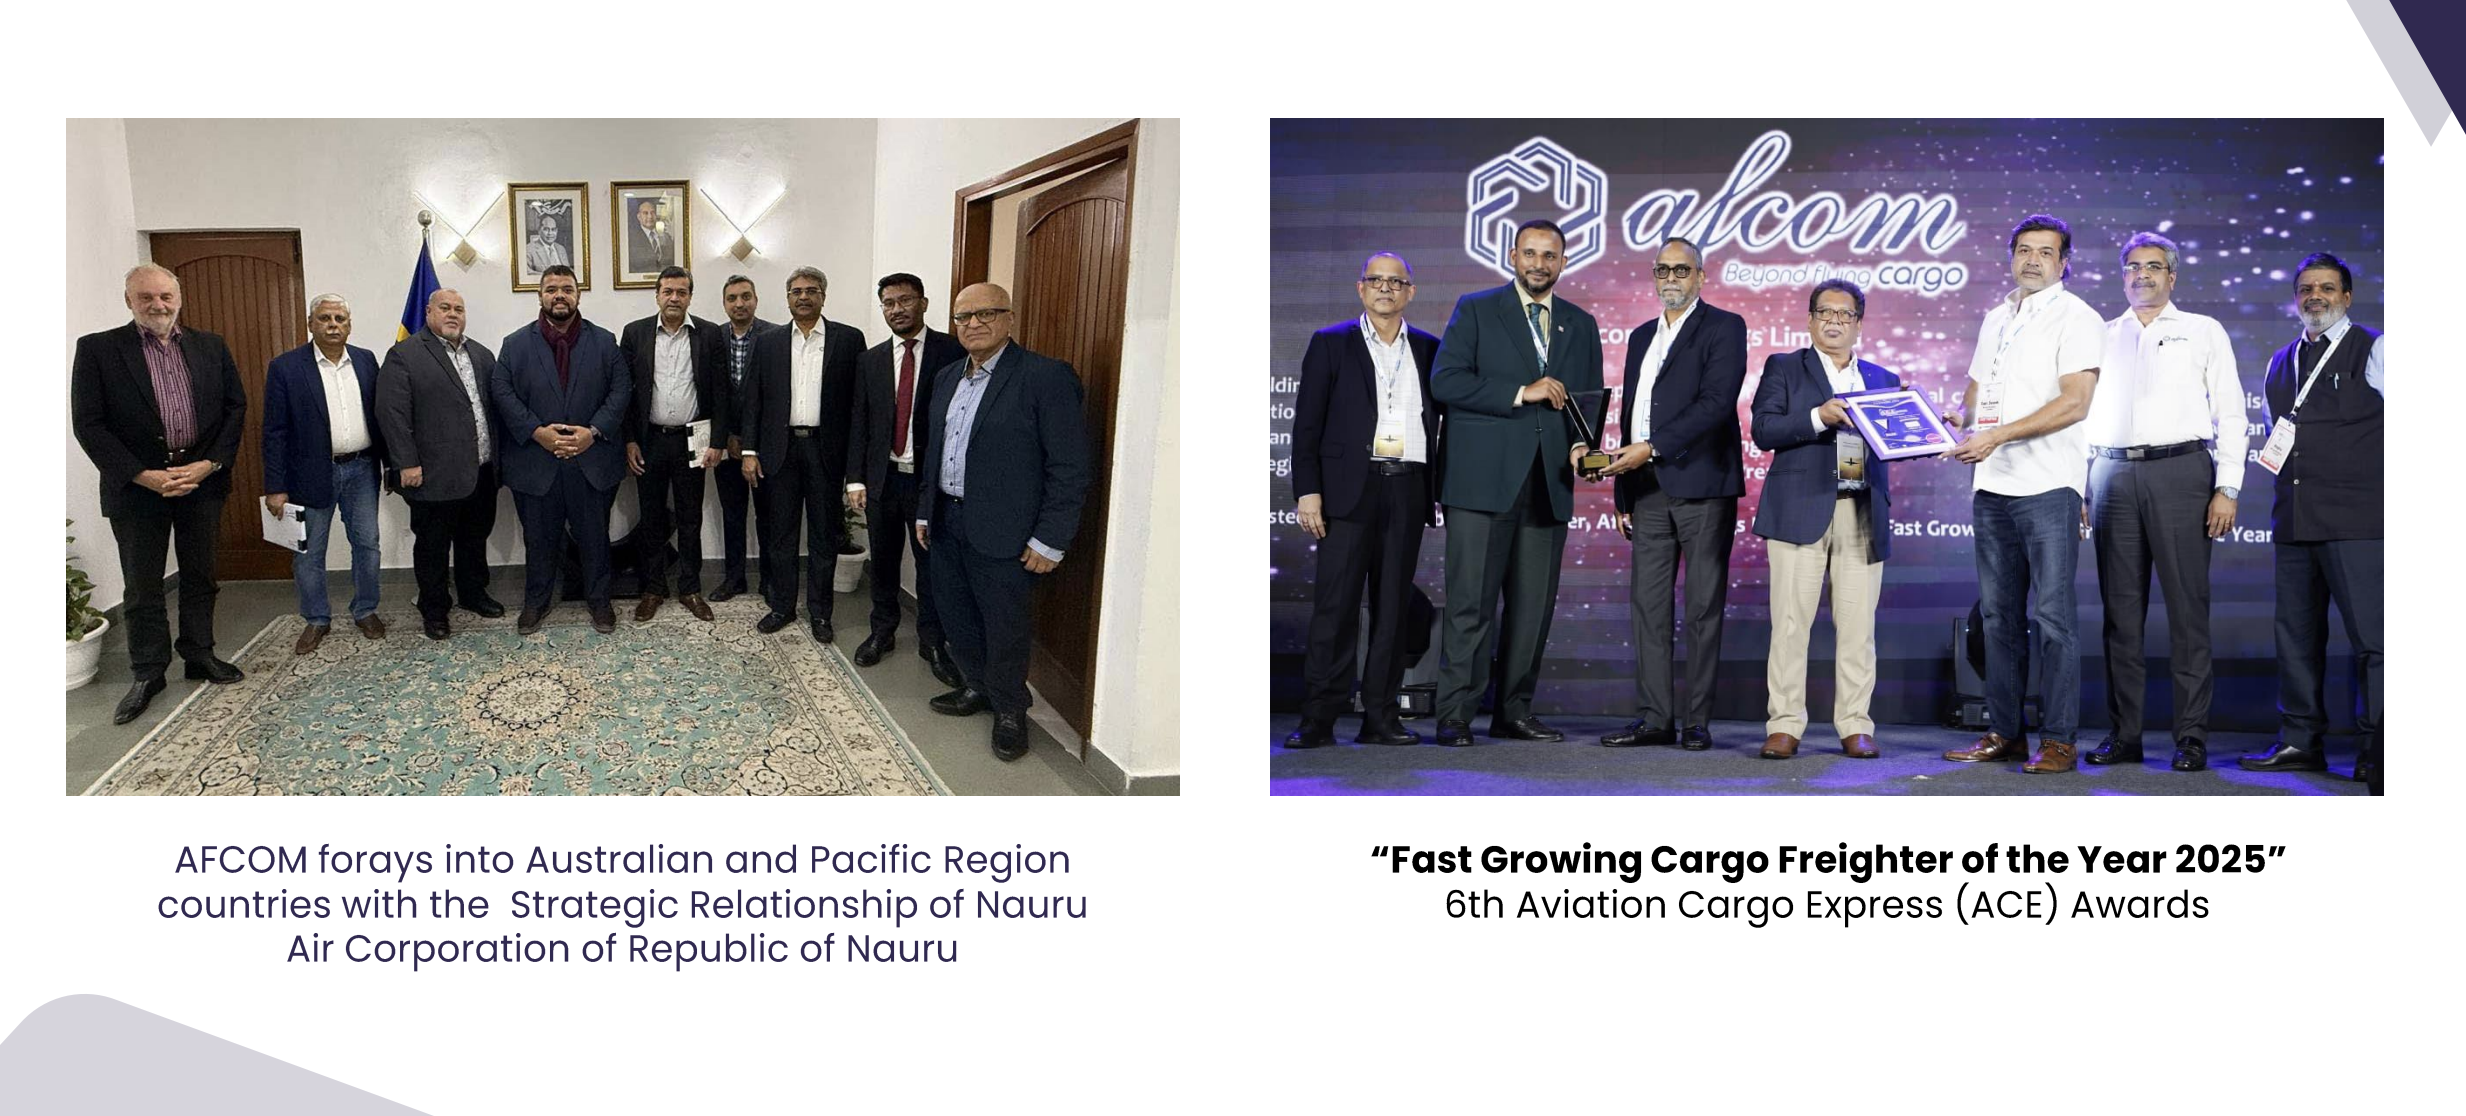
Six months into FY26, it inducted its third aircraft. By Dec 2025, a fourth arrived. March saw the fifth airborne. Simultaneously, promoter Capt. Deepak Parasuraman’s stake fell from 42.7% (Sep 2024) to 36.9% (May 2026)—diluted by equity raises and a ₹200 Cr QIP at ₹760/share in May 2026. On 19 Feb 2026, DGCA designated Afcom as a “Designated Indian Carrier,” unlocking a 5–7% ATF VAT exemption. It signed a six-year cargo pact with Nauru Air Corporation to serve Australia and the Pacific.
Acuite assigned a BBB+ rating (Stable) in Jan 2026.
3 — Business Model: WTF Do They Even Do?
Afcom rents freighters. It buys or dry-leases aircraft, staffs them, gets DGCA clearance, and hauls cargo between airports. Revenue per trip averaged ₹32,600 USD in Q3 FY26; average yield hit ₹2.56 per kg.
The competitive surface is simple: load factor, fuel, airport slot fees, crew cost. High debtor days (85 in FY26, up from 56 in FY24) mean cash lags invoice by months. Inventory is lean (18 Cr, mostly spare parts). The model is asset-heavy (aircraft ≈ ₹322 Cr net block in Mar 26) but operationally asset-light (no warehouses, no trucks, no hubs). Wet lease agreements lock in aircraft rental; fuel is commodity volatile.
Afcom spans domestic charters (shrimp, e-comm) and interline routes to Bangkok, Hanoi, Colombo, Male, Yangon. It serves 330 partner airlines. Its top customer concentration fell from 98.5% in FY24 to 85% in FY23—a slow march away from customer risk, though still lumpy. Hazardous cargo, odd-dimensional cargo, general cargo, and dangerous goods each command their own margin tiers.
4 — Financials Overview
Figures are consolidated, in ₹ crore.
Metric
Q4 FY26
QoQ
YoY
Revenue
190.33
+24.8%
+89.6%
EBITDA
89.25
+23.3%
—
PAT
44.66
+29.8%
+72.8%
EPS
₹17.13
—
—
Full Year FY26
Metric
Value
FY25
YoY
Revenue
583.11
238.72
+144%
Operating Profit
233.74
67.46
+247%
PAT
121.90
48.42
+152%
EPS (Full Year)
₹46.76
₹19.48
+140%
Narrative: Revenue tripled in nine quarters (Q2 FY25 to Q4 FY26) as the fleet scaled from one to five aircraft. Q4 benefited from the third and fourth aircraft ramping a full quarter. Operating profit, now ₹234 Cr (40% OPM), reflects high cargo yield and operational leverage on fixed hangar and crew costs. PAT margin improved to 20.9% from 20.3% (FY25), anchored by tax efficiency (6% effective rate in Q4, v/s 26% in prior quarters).
Depreciation hit ₹53 Cr in FY26 (₹4 Cr in FY25) because five aircraft at ₹60–70 Cr each now live on the balance sheet via asset capitalisation or lease accounting. Interest spiked to ₹32 Cr from ₹3 Cr—the ₹401 Cr borrowing docket at play.
5 — Market Expectations & Historical Multiples
This section describes how the market is currently pricing the company and how that compares with its own history and peer group. It is descriptive, not predictive.
Metric
Current
5-Yr Avg
Peer Median
P/E
20.5×
44.0×
24.0×
EV/EBITDA
11.9×
—
12.4×
P/B
4.90×
—
2.43×
ROE
36.0%
32.9%
10.72%
ROCE
33.5%
—
12.41%
The market pays 20.5× current trailing earnings here against the peer median of 24× (Container Corp. 27×, Blue Dart 40×, VRL 17×). The P/E is near its five-year nadir; Afcom traded at 44× on limited earnings history in early IPO days. Current multiple is lower—not a compliment to valuation but a marker that the market has repriced for execution risk.
The company’s own ROE (36%) and ROCE (33.5%) sit above the peer set and above its three-year average (33%). That margin profile is real. EV/EBITDA at 11.9× sits just below the peer median of 12.4×, suggesting the market is not