ACE Alpha Tech Ltd Mar 2026: 548 Working Capital Days and a CFO Exit Drama
Section 1 — At a Glance
Ace Alpha Tech Ltd has presented a paradox in its fiscal year 2026 performance, where blistering top-line acceleration meets severe working capital stress. The company recorded total sales of ₹24.23 crore for FY26, up from ₹15.53 crore in FY25, highlighting a 56.02% revenue growth trajectory driven by its algorithmic and institutional trading solutions. Profit after tax expanded to ₹15.20 crore, compared to ₹11.20 crore in the prior fiscal year. However, this profitability has failed to translate into liquid assets, as working capital days stretched significantly from 469 days to 548 days, completely trapping the company’s operating cash.
Investor attention is drawn to the high return ratios, with a Return on Capital Employed (ROCE) of 39.92% and a Return on Equity (ROE) of 29.80%. Yet, underlying these metrics is a deep financial risk: trade receivables escalated to ₹23.69 crore, effectively mirroring the entire annual revenue of the company. This structural bottleneck led to a negative cash flow from operating activities of ₹10.89 crore. Corporate actions have further complicated the narrative, marked by the sudden resignation of the Chief Financial Officer right before the finalization of the annual results, alongside an official proposal to utilize unallocated IPO expenses for human resources and to purchase refurbished hardware. When cash generation diverges dramatically from accounting profits, the structural integrity of reported growth demands deep scrutiny. The stock currently trades at a trailing price-to-earnings (P/E) multiple of 14.09, reflecting the market’s hesitation toward its cash-less expansion.
Section 2 — Introduction
Ace Alpha Tech Ltd, which entered the public markets via an SME IPO listing on July 3, 2025, finds itself at a critical junction. Founded in 2012, the firm transitioned from generic corporate and management consulting into a specialized provider of institutional-grade financial technology and automated trading systems.
This article explores the corporate dynamics following its recent capital raise of ₹32.22 crore. While top-line metrics display exponential scaling over a multi-year horizon, the internal mechanics of the financial statements reveal significant execution hurdles. With a fresh leadership change in the finance department and structural modifications to the utilization of its IPO proceeds, this analysis dissects whether the company’s proprietary trading software is building a sustainable moat or merely generating uncollectible invoices.
Section 3 — Business Model: WTF Do They Even Do?
Ace Alpha Tech develops institutional trading architecture. They sell algorithmic trading setups, risk management infrastructure, and custom interfaces that plug into order management systems used by prop desks, brokerages, and high-net-worth individuals.
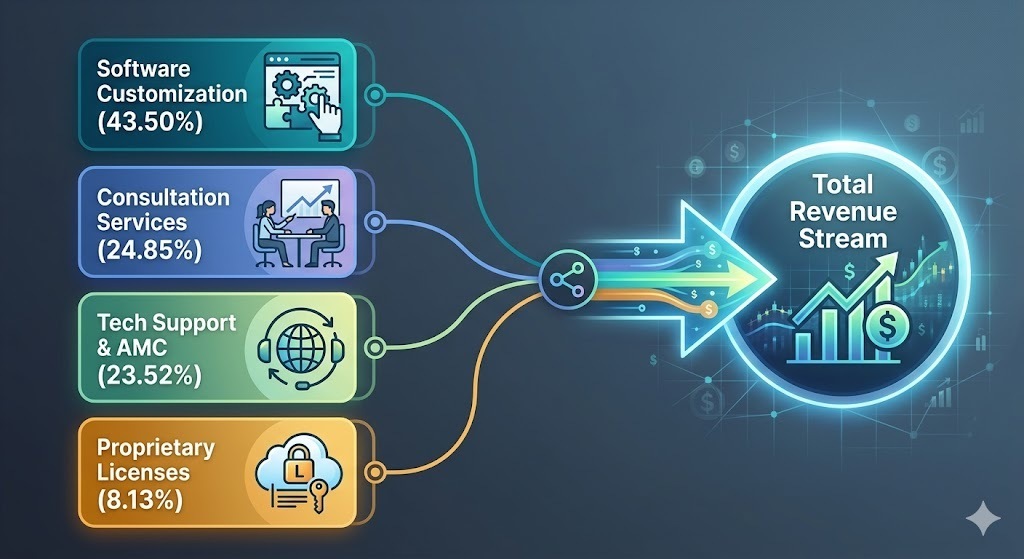
The revenue framework depends heavily on custom work, with customization fees making up 43.50% of its mix, followed by consultation services at 24.85%, and tech support/annual maintenance contracts at 23.52%. Licensing fees contribute a small 8.13%. Geographically, it is concentrated in North India, with Delhi and Uttar Pradesh driving 44% and 27% of billings respectively. Customer concentration is high: the top five clients command 43% of sales, and the top 10 capture 67%. This creates a vulnerability where a single client dispute can severely disrupt the balance sheet.
Section 4 — Financials Overview
Figures are standalone, in ₹ crore.
Comparison Table
Metric
Latest Half (Mar 2026)
YoY (Same Half)
Previous Half (Sep 2025)
Revenue from Operations
₹15.26
69.56%
₹8.98
EBITDA / Operating Profit
₹11.16
64.12%
₹7.68
PAT
₹7.68
2.40%
₹7.52
Reported EPS (₹)
₹4.37
0.69%
₹4.28
The sequential growth from the first half to the second half of FY26 shows a top-line expansion to ₹15.26 crore. However, operating margins came