1. At a Glance
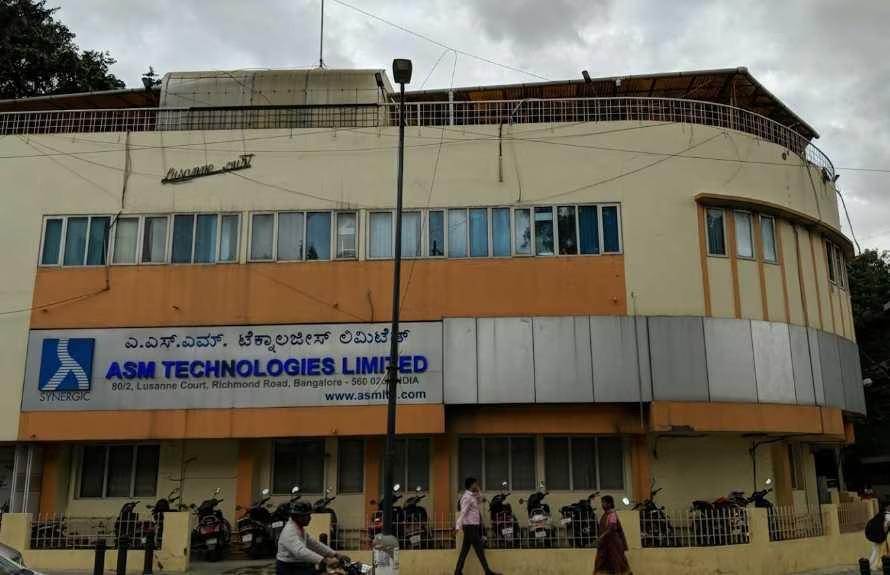
ASM Technologies is a boutique tech wizard with global dreams and a P/E ratio that screams, “YOLO.” Despite being smaller than your favorite mid-cap startup, it’s acquired, merged, and expanded like a caffeinated octopus. But is there substance behind the swagger?
2. Introduction with Hook
Imagine if a startup, a consultancy, and an engineering nerd walked into a bar… and came out as ASM Technologies.
- Stock CAGR (5Y): 143% — even your crypto cousin is impressed.
- P/E: 127 — that’s not a typo, that’s investor optimism doing backflips.
With offices from Bengaluru to Buckinghamshire and acquisitions all over the place, ASM’s got hustle. But is it profitable hustle or powerpoint hustle?
3. Business Model (WTF Do They Even Do?)
ASM Technologies is into:
- Engineering Services
- Product R&D
- Consulting & Digital Transformation
They specialize in verticals like: - Semiconductor
- Automotive
- Aerospace
- Industrial manufacturing
Their key approach: “We’ll design it, test it, simulate it, optimize it, and if needed… we’ll acquire someone to do it faster.”
Offshore development centers in India are their cost advantage, while foreign acquisitions give them the tech depth. The catch? It’s a highly fragmented industry, so moat = debatable.
4. Financials Overview
Profit & Loss Snapshot (₹ Cr):
| Year | Sales | Net Profit | OPM | EPS |
|---|---|---|---|---|
| FY22 | 192 | 14 | 11% | 13.28 |
| FY23 | 220 | 7 | 9% | 8.68 |
| FY24 | 202 | -7 | 3% | -3.64 |
| FY25 | 289 | 25 | 16% | 22.28 |
Highlights:
- FY24 was a speed bump (losses), FY25 was a trampoline (3.5x jump in PAT).
- Sales CAGR (5Y): 26%
- Profit CAGR (5Y): 172% (aka rocket fuel levels)
5. Valuation
P/E: 127
Book Value: ₹140
CMP: ₹2715
Price / Book: 19.35 (We’re past fundamentals; we’re in faith-based investing now.)
Fair Value Estimate (Range):
- DCF Method: ₹1000–₹1400 (Assumes sane world)
- Peer Comparison (Persistent etc.): ₹1600–₹1900
- Hope + Hype Model (Real World): ₹2000–₹2400
EduFair Range™: ₹1400–₹1900
This gives plenty of cushion below CMP if reality catches up.
6. What’s Cooking – News, Triggers, Drama
- Acquisitions Galore: Semcon Engineering UK, RV Forms & Gears — if it moves, ASM buys it.
- ₹510 Cr investment in Karnataka: Big bet on infra and digital parks
- Preferential allotment, Warrant conversions: Dilution, but with expansion intentions
- NCLT merger approval for ASM Digital Engineering: Simplifies operations, improves focus
TLDR: They’re expanding fast. Possibly faster than they should.
7. Balance Sheet
| Metric | FY23 | FY24 | FY25 |
|---|---|---|---|
| Equity Capital | 10 | 12 | 12 |
| Reserves | 61 | 130 | 153 |
| Borrowings | 74 | 82 | 86 |
| Fixed Assets | 48 | 49 | 76 |
| Total Assets | 169 | 238 | 287 |
Key Takeaways:
- Borrowings increasing, but matched by reserves = not scary yet
- Fixed asset build-up = infra-heavy growth bet
8. Cash Flow – Sab Number Game Hai
| Year | CFO | CFI | CFF | Net |
|---|---|---|---|---|
| FY23 | ₹20 Cr | ₹-25 Cr | ₹4 Cr | ₹-1 Cr |
| FY24 | ₹-1 Cr | ₹-66 Cr | ₹68 Cr | ₹1 Cr |
| FY25 | ₹-23 Cr | ₹33 Cr | ₹-9 Cr | ₹0 Cr |
Narrative:
Operating cash is lumpy. Heavy capex in FY24-25 likely due to Semcon + infra builds. Financing did the heavy lifting.
9. Ratios – Sexy or Stressy?
| Metric | FY23 | FY24 | FY25 |
|---|---|---|---|
| ROCE | 13% | -1% | 20% |
| ROE | 8% | -3% | 16.5% |
| Working Capital Days | 66 | 78 | 172 |
| Debtor Days | 90 | 94 | 163 |
Verdict:
ROCE recovered, ROE decent — but debtor days are partying like it’s 2008. Not ideal.
10. P&L Breakdown – Show Me the Money
| Year | Revenue | Op Profit | Net Profit | OPM % | NPM % |
|---|---|---|---|---|---|
| FY23 | ₹220 Cr | ₹21 Cr | ₹7 Cr | 9% | 3% |
| FY24 | ₹202 Cr | ₹6 Cr | ₹-7 Cr | 3% | -3% |
| FY25 | ₹289 Cr | ₹47 Cr | ₹25 Cr | 16% | 9% |
Pattern:
This is a company trying to bulk up for the big league — and FY25 was chest day.
11. Peer Comparison
| Company | P/E | ROE | OPM | Sales (₹Cr) | Market Cap (₹Cr) |
|---|---|---|---|---|---|
| ASM Tech | 127 | 16.5% | 16% | 289 | 3196 |
| Persistent | 64 | 24% | 17% | 11938 | 87237 |
| LTIMindtree | 33 | 21.5% | 17% | 38008 | 154395 |
| TechM | 39 | 14.6% | 13% | 52988 | 156913 |
Reality Check:
ASM is still a fraction of mid-sized peers but priced like it’s already a global star.
12. Miscellaneous – Shareholding, Promoters
- Promoter Holding: Down from 62.5% → 57.09% in 2 years
- Public Shareholding: Up from 37% → 42.67%
- FIIs/DIIs: Still allergic — under 0.5% combined
- No. of Shareholders: Doubled in 2 years (the hype is real)
Translation:
Retail junta is in. Promoters are slightly out. Institutions are watching with popcorn.
13. EduInvesting Verdict™
ASM is like that friend who suddenly starts gymming, dressing up, and talking about “startups in Eastern Europe.” You want to root for them — but also want them to chill and focus.
- The company is scaling fast, but fundamentals are playing catch-up.
- Margins and cash flow improved in FY25, but consistency is key.
- That P/E needs to calm down, unless next year’s EPS drops the mic.
Written by EduInvesting | 12 July 2025
Tags: ASM Technologies, Tech Stocks, Engineering R&D, Small Cap IT, Valuation, High P/E Stocks


