Maan Aluminium FY26: Flat Revenue, Margin Squeeze, Capacity Awaiting Lift
General information and entertainment, not investment advice. The author is not a SEBI-registered adviser or research analyst. No recommendation, no promised returns. Markets carry risk including loss of capital. Figures may not be current. Consult a registered adviser before acting.
1. At a Glance
The data sheet shows revenue flatlined at ₹809 crore in FY26 (FY25: ₹810 crore). EBITDA inched up 3% to ₹31 crore, but that gain evaporated on the profit line—PAT dropped 19% to ₹13 crore. The margin erosion is visible: operating margin halved from 4% (FY25) to 2% (FY26), while OPM in Q4 alone touched 0.64%.
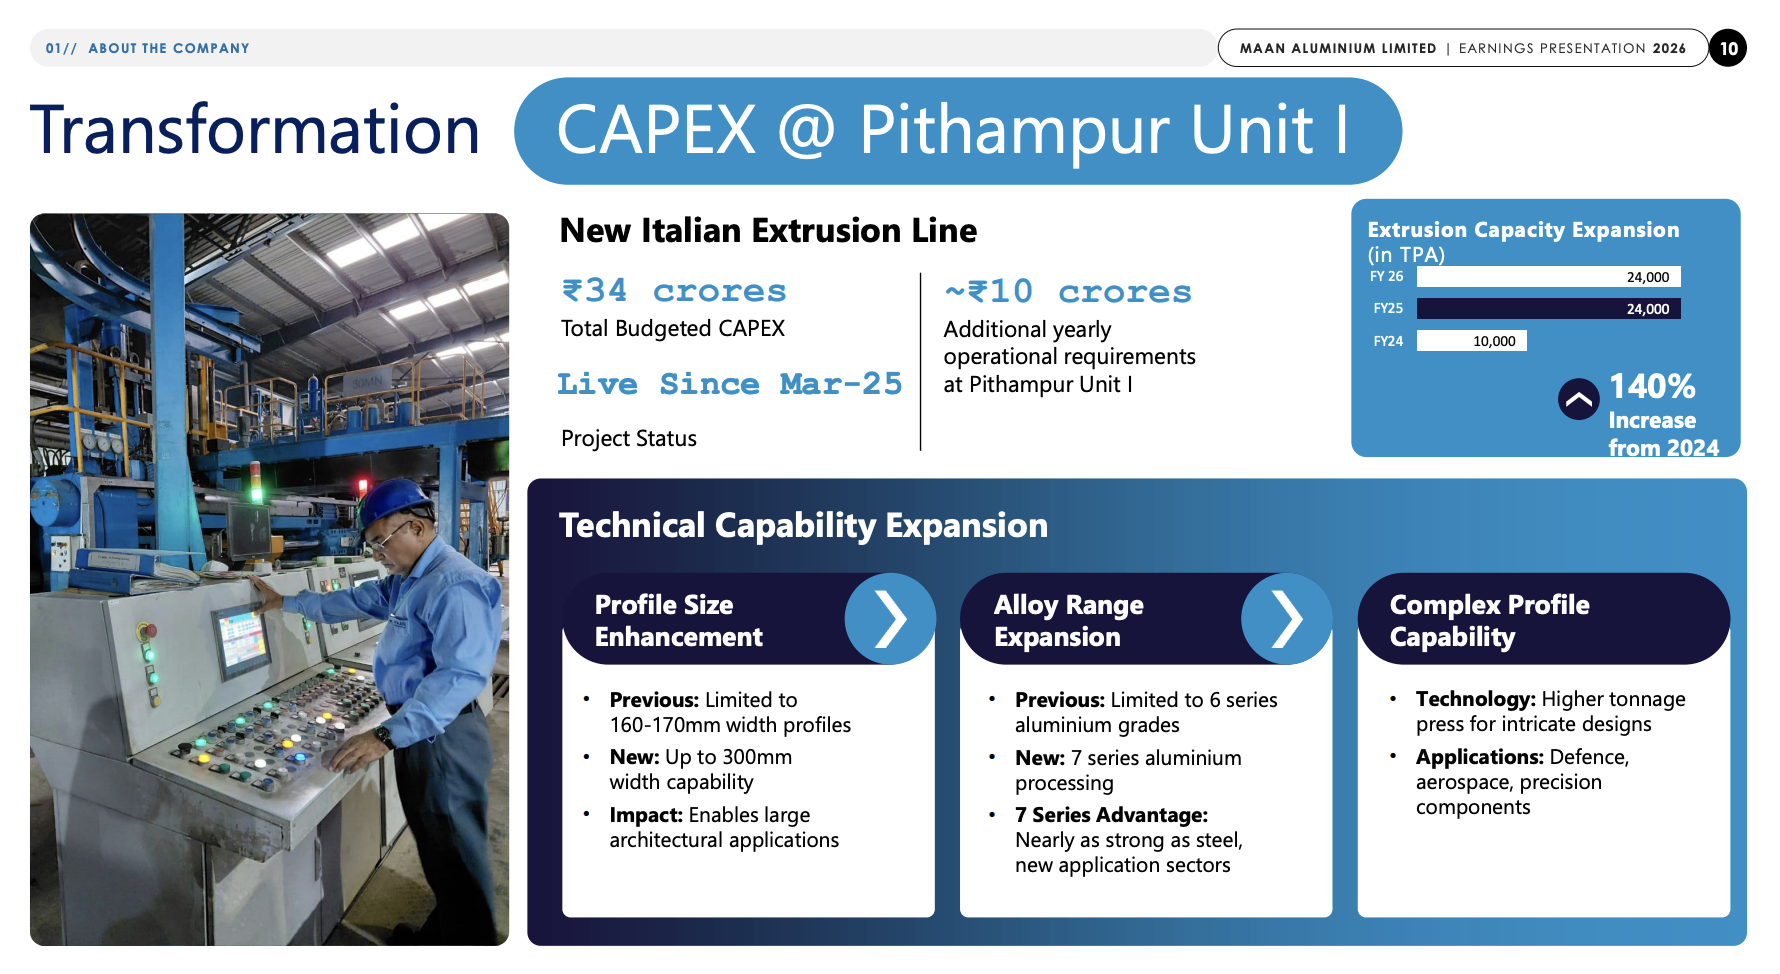
Energy costs and export weakness bore down on profitability; management framed it as deliberate ramp-up costs. The company financed ₹83 crore via preferential issue in January 2026, raising net worth 54% from ₹178 crore to ₹274 crore. Extrusion capacity doubled from 10,000 TPA to 24,000 TPA with the new Italian press, but utilization lags the ambition.
A platform in flux: capacity swollen, earnings hollow, execution proving slower than the script.
2. Introduction
Maan Aluminium is two decades into the business of manufacturing and trading aluminium extrusion products, with in-house anodising and fabrication arms. The company is an exclusive distributor of Hindalco for billet and ingot trading across North India and South India (barring Hyderabad).
In March 2025, the company acquired a sick unit in Dewas, Madhya Pradesh for ₹8.75 crore, slated for precision tubing and downstream value-add. Land acquisition spend in December 2024 (₹9 crore) and ongoing capex signal a multi-year buildout. The latest capex guidance spans FY27–FY28: ₹40–50 crore in FY27, ₹35–40 crore in FY28.
Promoter Ravinder Nath Jain holds 48+ years of experience; his stake settled at 37.08% as of March 2026 after dilution from the preferential issue. The public float has drifted upward to 42.59%.
3. Business Model: WTF Do They Even Do?
The company splits into two verticals: manufacturing (higher-margin focus going forward) and trading (legacy, shrinking).
Manufacturing spans extrusion with 24,000 TPA capacity (four hydraulic presses: 900T, 1200T, 1450T, 3000T), foundry (12,000 TPA via two furnaces), anodizing (3,600 TPA, Class-1 finish to 22 microns), and machining (1,400 TPA). The new Italian press handles 7-series alloys and profiles up to 300 mm width, enabling aerospace, defence, and architectural applications. Prior capacity maxed at 160–170 mm and 6-series only.
Trading buys aluminium ingots and billets from Vedanta, National Aluminium Company, Hindalco, and imports. Management has de-emphasized this vertical—FY26 9-month revenue was 59% trading, 41% manufacturing, signalling a intent to rebalance toward higher-value-add.
The product list sprawls: hardware, solar, defence, LED, electrical, railways, atomic research, automotive profiles. Customer count: 300+. Export reach: six countries (USA, UAE, Australia, UK, Qatar, Israel), with US representing 80–85% of export volumes.
Capacity utilization in extrusion hit 31.8% in FY25 (latest reported). Translation: the new Italian press is barely breathing, two-thirds sitting idle waiting for customer qualification cycles to mature.
4. Financials Overview
Figures are consolidated, in ₹ crore, quarterly basis.
Metric
Latest Q (Q4 FY26)
YoY
QoQ
Revenue
254.57
+4%
+68%
EBITDA
1.64
-44%
-29%
Operating Margin
0.64%
—
—
PAT
1.70
-50%
-33%
EPS
0.28
—
—
Q4 FY26 saw revenue lift 4% YoY but operating profit crashed 44%. Management cited “oil and energy crisis” and “government restrictions on gas supply,” compounding energy cost runaway. Manufacturing margin remains under siege: the gross margin (revenue less raw material cost and inventory movement) compressed to 7.5% from 8% a year prior.
Full-year FY26: revenue ₹809 crore (flat), EBITDA ₹31 crore (+3%), PAT ₹13 crore (-19%), EPS ₹2.17 (annualised, down from ₹2.87). The annual OPM slid to 2% from 4% in FY25.
Concall colour: management described FY26 as “strategic transformation,” pivoting from commodity extrusion to value-add, with ramp-up costs suppressing near-term earnings. CFO guided FY27 ramp costs of ₹7–10 crore in incremental depreciation, finance, wages, and trial runs. The thesis hinges on utilization climb and value-add mix maturation.
5. Market Expectations & Historical Multiples
This section describes how the market is currently pricing the company and how that compares with its own history and peer group. It is descriptive, not predictive.
Metric
Current
5-Year Average
Peer Median (8 Co.)
P/E
56.4
16.3
15.6
EV/EBITDA
24.5
—
—
ROE
5.75%
18.7%
11.51%
ROCE
7.73%
12% (3-yr)
13.67%
The market currently pays 56.4x earnings here against a peer median of 15.6x. The gap screams: either the market is pricing a recovery narrative hard, or earnings are so depressed that the ratio distorts.
ROE has cratered to 5.75% from a 5-year median of 18.7%. ROCE landed at 7.73%, half the 3-year average of 12%