Sahasra Electro FY26: 45% Revenue, ₹14.2 Cr Profit, 6% ROCE
General information and entertainment, not investment advice. The author is not a SEBI-registered adviser or research analyst. No recommendation, no promised returns. Markets carry risk including loss of capital. Figures may not be current. Consult a registered adviser before acting.
1. At a Glance
Sahasra Electronic Solutions posted FY26 revenue of ₹138.8 Cr, up 45% from ₹95.8 Cr in FY25. Net profit swung from a ₹2.3 Cr loss to ₹14.2 Cr profit—a 606% reversal.
The profit jump looks dramatic only if you squint at the numerator. Net profit as a percentage of sales stayed at 10.2%, suggesting the earnings are real but not miraculous. Other income hit ₹9.7 Cr (7% of sales), including government subsidies for semiconductor capex.
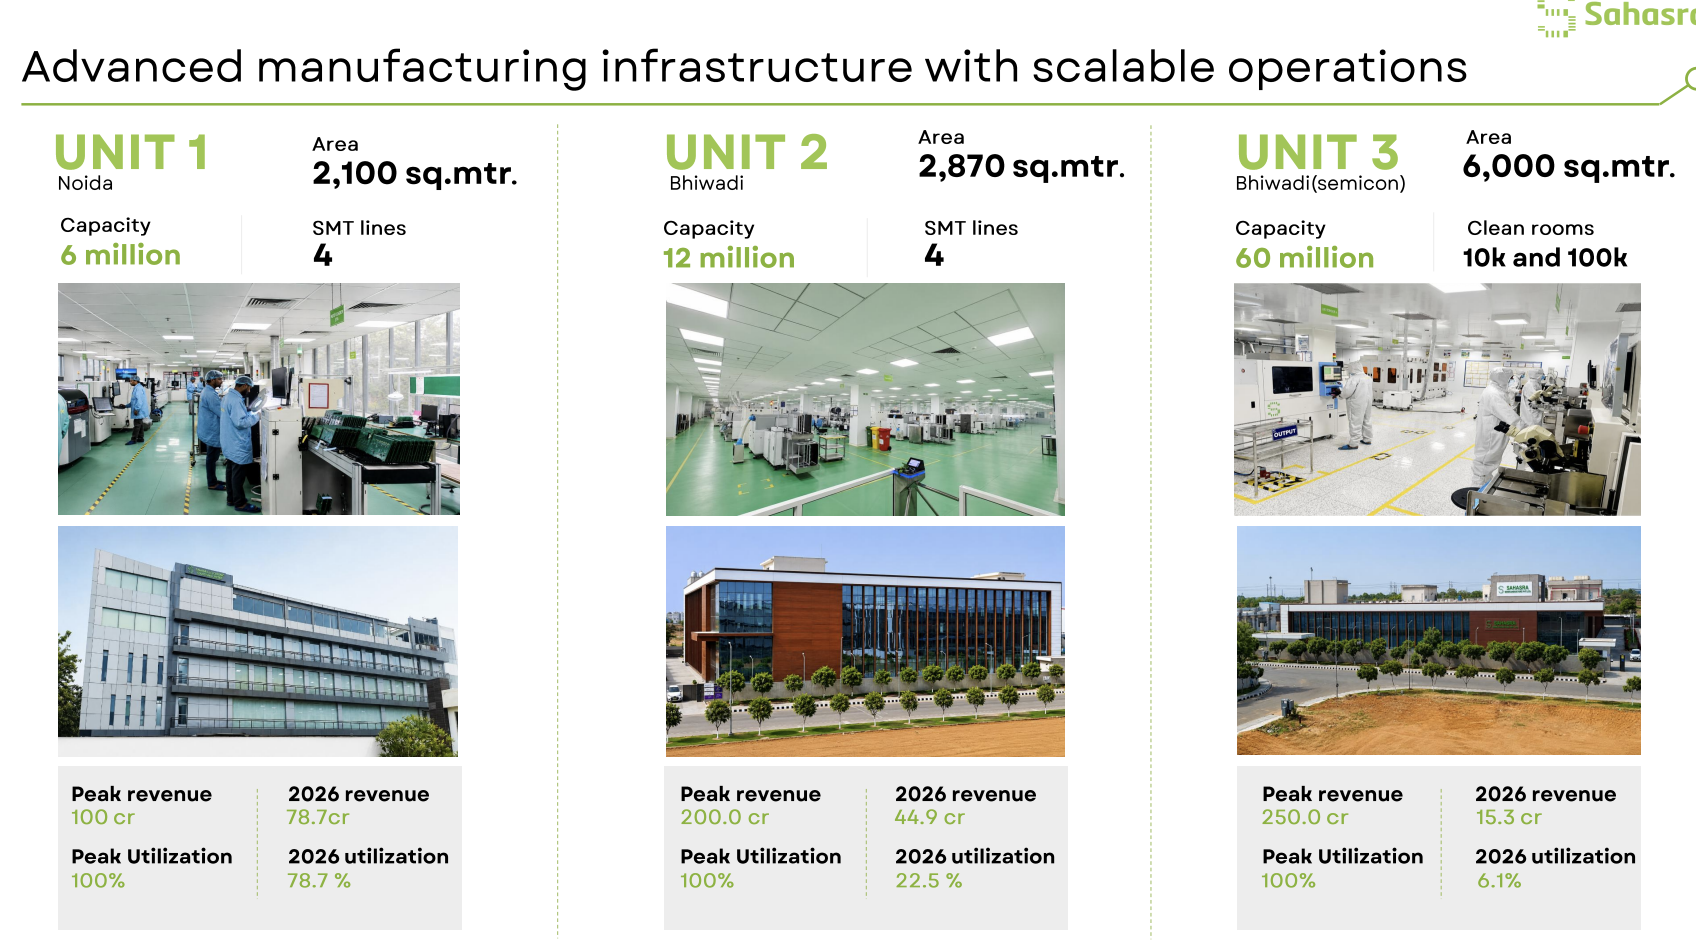
The order book sits at ₹68.5 Cr, roughly half the annual revenue. Utilization at the older Noida facility hits 80%; the newer Bhiwadi plant remains at 20%. Debtor days have stretched to 115 from 103, a sign of either customer mix shift or competitive pressure. Inventory days linger at 130.
The stock trades at 52.4x trailing P/E against a peer median of 23.8x. The company’s ROCE is 6%, while ROE is 6%. The question isn’t whether it’s cheap—it isn’t—but whether the growth narrative justifies the math.
2. Introduction
Sahasra was incorporated in February 2013 and listed on NSE SME Emerge in October 2024 after raising ₹186 Cr via IPO. The capital has been earmarked for capex, subsidiary investment, and working capital—the typical playbook for ESDM companies building scale.
The semiconductor business (54% stake in Sahasra Semiconductor Private Limited) is an investment phase operation. The Electronics Manufacturing Services (EMS) arm—PCB assembly, wire harness, box build solutions—is the revenue anchor at ~66% of sales in FY26.
The company operates two main facilities: Noida (4 SMT lines, 80% utilization) and Bhiwadi in Rajasthan (4 new SMT lines, commissioned April-May 2026, currently 20–22% utilized). The fresh Bhiwadi capacity is marketed as higher-throughput, capable of double the Noida output at peak. A merger with three subsidiaries is pending NCLT approval, expected by end of FY27, which will consolidate unlisted operating entities (estimated ₹85–₹90 Cr additional revenue) into the listed parent.
3. Business Model: WTF Do They Even Do?
Sahasra operates as an ESDM integrator across five verticals.
EMS (Electronics Manufacturing Services) is the bulk. Customers send circuit designs; Sahasra sources components, manufactures PCBs, assembles, and tests. Applications span IoT electronics, industrial electronics, metering solutions, EV-related products, instrumentation, and GPS devices. The business is high-mix, medium-volume—not a commodity play, but not bespoke either. Top 5–7 customers drive visibility, though none sign beyond one year. Management flagged ~90% customer retention and ~92% repeatability. The operating margin here is ~32% gross, compressed by labor and logistics.
Semiconductor packaging and ATMP (memory-led) remains a loss operation, though losses have shrunk. The business capitalizes on customers seeking non-China alternatives and India’s geopolitical neutrality. Customers in AI-boosted memory demand have begun qualification cycles, but these are glacial—months to years. The company expects the semiconductor division to hit ₹50 Cr revenue in FY27; at that level, management claims zero cash losses (though depreciation may remain unrecovered).
Memory solutions—finished goods like microSD, USB, DDR modules, SSD drives—sit in a middle ground. Designed to exploit the consumer gap (“big companies left a void”) while graduating into industrial segments with better margins.
IT Hardware experienced a false start. A European brand engagement fell through; the company has signed another brand but hasn’t announced details. Target contribution: 5–7% of revenue.
LED Lighting (4% of FY26 revenue, 20% margin) is the cash-generator—a mature, profitable segment.
The geographic mix has pivoted sharply. FY25 was 80% exports; FY26 sits at roughly 51% exports and 49% domestic. This rebalancing was a deliberate response to export macro weakness, tariff headwinds, and the pursuit of domestic customer wins (though at a cost—longer payables, higher inventory).
4. Financials Overview
Figures are consolidated, in ₹ crore.
Metric
FY26
FY25
YoY Change
Revenue
138.8
95.8
+44.8%
EBITDA
27.8
7.5
+270%
PAT
14.2
2.8
+407%
EPS (annualized)
5.68
1.12
+407%
H2 FY26 Snapshot (from concall):
Revenue ₹78.1 Cr (vs ₹49.5 Cr in H2 FY25).
EBITDA ₹7.6 Cr at 9.7% margin (vs a loss of ₹0.6 Cr at -1.1% margin in H2 FY25).
The turnaround is real. H1 FY26 was weaker (EBITDA negative at -1.1%), which means H2 carried the recovery.
Other income context (from concall): Management recognized ₹21.8–₹22 Cr in semiconductor subsidies (SPECS scheme) as deferred income in Q4 FY26. This is amortized over ~15 years, so only a fraction hits the P&L annually. Interest on IPO funds parked in FDs accounts for part of the remaining ₹9.7 Cr other income. Strip out the subsidy recognition and the “true” operating profit is tighter than it appears.
Working Capital Stress: Operating cash flow was negative at ₹10.1 Cr (vs ₹5.9 Cr negative in FY25). Management attributed this to inventory buildup (2–3 months to ensure supply continuity amid geopolitical risk) and extended credit terms to retain/win domestic customers post-FY25 weakness. Management expects CFO to turn positive by end of FY2028—a 2-year runway.
5. Valuation Discussion: Fair Value Range (Educational Only)
What follows is a walkthrough of how three valuation methods work, using this company’s numbers as the example — not a target, not a forecast, not advice.
Method 1 (P/E): Annualized EPS is ₹5.68 (FY26, full year, no multiplication). The peer band for ESDM-adjacent companies ranges 23.8x–55x P/E. Applying the band to this company’s EPS produces a range: 5.68 × 23.8 = ₹135, and 5.68 × 55 = ₹312.
Method 2 (EV/EBITDA): FY26 EBITDA is ₹27.8 Cr. Adjusting for net debt (borrowings ₹66.6 Cr less cash ₹23.5 Cr = net debt ₹43.1 Cr), Enterprise Value = Market Cap + Net Debt = 743.28 + 43.1 = ₹786 Cr. EV/EBITDA = 786 / 27.8 = 28.3x. Peer EV/EBITDA medians range 12–35x for industrial products. At the lower end (12x), arithmetic produces EV of 27.8 × 12 = ₹333 Cr; backing out net debt gives equity value ₹290 Cr or ~₹116 per share. At the peer median (16x), EV = ₹445 Cr, equity value ₹402 Cr or ~₹161 per share.
Method 3 (Simplified DCF): Free cash flow for FY26 was negative on operating